
What Is a Good ROAS for Facebook Ads? (2026)
What counts as a good ROAS for Facebook ads, how to find your break-even from your margin, why your blended ROAS beats the platform number, and why a weak ROAS is usually a creative problem, not an audience one.
Updated September 2026 · Likit Sae Lee, CTO

A good ROAS for Facebook ads is anything above your break-even, which is 1 divided by your profit margin: a 50% margin breaks even at 2.0x, a 25% margin needs 4.0x. There is no universal target. The Corporate Finance Institute frames roughly 4:1 as strong for thin-margin e-commerce, 2:1 as enough for high-margin businesses, and 1.5:1 as acceptable during a deliberate growth phase, with 1:1 the exact break-even line. Treat the commonly quoted 2-3x averages as rough goalposts, not goals, because most are vendor estimates and the 2026 attribution change makes older numbers hard to compare. When ROAS sits below your break-even, the durable fix is a sharper creative angle and tighter tracking, not a fresh audience. And read the dashboard number for what it is: Meta's own attributed figure. Your blended ROAS, total revenue over total ad spend across every channel, is what reconciles the dashboards against reality.
You spent $1,000, the dashboard says 3.2x, and you still have no idea whether that is a win. ROAS feels like a grade, so a number that looks fine can quietly be losing money while a number that looks low is comfortably in the black. The honest answer is that there is no good ROAS in the abstract: there is only your break-even, the line your margin draws, and how far above it you are sitting. Find that line and most of the confusion goes away.
ROAS is a scoreboard, not a steering wheel
ROAS, return on ad spend, is the simplest ad metric to read and the easiest to misread. It is conversion revenue divided by ad spend: a 4.0x ROAS means you earned $4 in tracked sales for every $1 you put into the ad. In Ads Manager the column is labelled Purchase ROAS (return on ad spend), and it pulls whatever conversion value your Meta Pixel or dataset reports back. That makes it a fast health check on the advertising and a poor verdict on the business.
The reason it misleads is that it tells you the size of the return without telling you whether the return is enough. A 3.2x looks healthy on the dashboard and can still be quietly underwater, while a 2.0x can be comfortably profitable. ROAS measures how hard your spend is working. It does not measure whether your store is making money. For that you need a second number, and you almost certainly already have it.
ROAS is not ROI, and the difference is your margin
The line everyone blurs is ROAS versus ROI. ROAS uses revenue, the top line, before anything is taken out. ROI, or profit, uses what is left after the cost of goods sold, shipping, payment fees, and the ad spend itself. A campaign can post a strong ROAS and a negative profit at the same time, which is exactly how brands scale themselves into trouble.
Work a quick example. Sell a product for $100 at a 30% margin, so you keep $30 per sale before ad cost. At a 3.0x ROAS, $1 of spend returns $3 of revenue, but that $3 of revenue only carries $0.90 of margin, less than the $1 you spent. A 3x ROAS, the kind of number that gets a campaign celebrated, is losing ten cents on the dollar. The dashboard never tells you that, because the dashboard does not know your margin. You do.
Real ad examples show how brands engineer their way out of this trap by moving margin and order value before they ever touch the audience. Glad2Glow runs a five-piece skincare bundle at RM58.50: bundling raises the average order value and packs more margin into a single transaction, so the same ad spend clears a lower ROAS bar because each order is worth more. At the other end, Dasher advertises an air purifier at RM569 down from RM699, a thin-margin, high-ticket category where a respectable-looking ROAS can still sit at or below break-even once the unit cost is paid. The prices are illustrative of the margin mechanics, not live spend, but the lesson is exact: the ad metric did not change, the economics underneath it did.
Break-even ROAS: the only target that matters
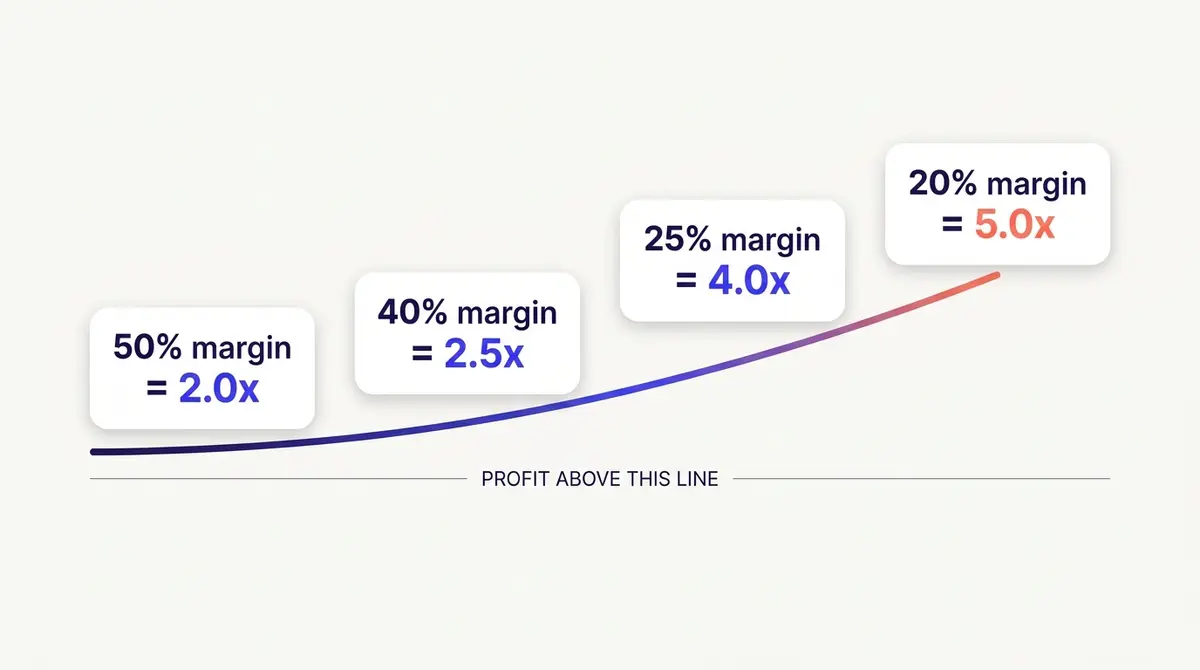
Here is the formula that replaces every borrowed benchmark. Your break-even ROAS equals 1 divided by your profit margin. Above that line is profit. Below it you are paying to lose money. Compute the margin after the cost of goods, shipping, payment fees, and returns, not as a gross markup, or the bar comes out too low and the campaign looks profitable when it is not.
| Profit margin | Break-even ROAS | Plain reading |
|---|---|---|
| 50% | 2.0x | Every $1 of spend must return $2 to break even |
| 40% | 2.5x | Healthy-margin DTC, mid bar |
| 25% | 4.0x | Thin-margin retail, high bar |
| 20% | 5.0x | Very thin margin, the bar most stores underestimate |
These figures are arithmetic, not a survey: 1 divided by 0.5 is 2.0, 1 divided by 0.25 is 4.0. That is what makes them trustworthy. They do not depend on anyone's sample or attribution settings. Once you know your margin, you know your line, and every ROAS the dashboard shows can be read against it in a second. A campaign at 3.0x is a triumph for the 50% margin store and a slow leak for the 25% margin one.
This is also why the famous goalposts only work as goalposts. The Corporate Finance Institute frames roughly 4:1 as strong for thin-margin e-commerce and retail, 2:1 as usually sufficient for a high-margin business such as software or luxury, 1.5:1 as acceptable during a deliberate growth or penetration phase, and 1:1 as the exact break-even where you neither profit nor lose. Useful for a gut check. Useless as a target, because they are stand-ins for a margin assumption you can just calculate directly.
Two worked examples: a physical product and a subscription
The break-even table assumes you already know your margin, and most people guess it. So here is the formula and two cases that show how to get an honest number. Gross margin is revenue minus the cost of goods sold, divided by revenue, per the Corporate Finance Institute, and for ad math you push every variable cost into that figure, not just the factory price.
Take a physical product sold at $100. The unit costs $44 to make and land, shipping runs $8, and the payment processor takes $3. That is $55 of variable cost, so your gross margin is (100 minus 55) divided by 100, or 45%. Your break-even ROAS is 1 divided by 0.45, about 2.2x. A campaign at 2.0x, the number that clears the 50% margin store in the table, is quietly losing money here. Same dashboard, different line, because the costs underneath are different.
Now a subscription, where the first order never tells the whole story. Say you charge $25 a month at a 70% gross margin, and the average customer stays about ten months, so each one is worth roughly $175 in gross profit over the relationship. If it costs $58 in ad spend to acquire one, your first-month ROAS is $25 divided by $58, about 0.43x, a number that looks like a catastrophe on day one. It is not. Your lifetime-value-to-acquisition-cost ratio is $175 to $58, almost exactly 3 to 1, the level HubSpot treats as healthy, and you recover the $58 in roughly three to four months of billing. The first-order ROAS is the wrong ruler for that business. If you want the calculation itself laid out step by step, start there, then come back to set the target.
The highest ROAS is rarely the most profit
Chasing the biggest ROAS number is the most expensive mistake in this whole topic, because average ROAS falls as you spend more. The first dollars reach the people most ready to buy. Each extra dollar reaches someone a little less ready, so the average return drifts down as the budget climbs. Hold out for the highest possible ROAS and you end up underspending, leaving money on the table to protect a vanity number.
What you actually want to maximise is total profit, and that means watching the marginal return, what the next slice of spend earns, not the average. Work it through at a 50% margin, where break-even is 2.0x. At $1,000 a day the campaign returns 4.0x: $4,000 of revenue, $2,000 of gross profit, $1,000 of net profit after the spend. Push to $3,000 a day and the average ROAS sags to 2.8x. That looks worse, but it is $8,400 of revenue, $4,200 of gross profit, and $1,200 of net profit, more money than the tidy 4.0x made. The extra $2,000 of spend pulled in $4,400 of revenue, a marginal ROAS of 2.2x, still above your 2.0x break-even, so it added profit even as the headline number dropped.
The rule that falls out of this: keep scaling while the marginal return sits above break-even, and stop when it reaches it. A return that looks too good is often a sign you are under-spending rather than winning. In subscription terms, a lifetime-value-to-acquisition ratio climbing above about 4 to 1 can mean you are leaving growth on the table. Scaling without resetting the learning phase is its own discipline, but the decision of when to scale is this one.
Why a single Facebook ROAS average is meaningless
Every few months a new average Facebook ROAS makes the rounds, usually somewhere between 2x and 3x. Resist anchoring on it. Almost all of those figures come from advertising-tool vendors measuring their own customer base, not from neutral, independent studies, so they say more about who pays for that tool than about what your store should expect. If you must keep one in your head, hold it as a loose sanity check and nothing more.
What you can trust are dated, neutral cost benchmarks, because they expose how wildly the inputs swing. WordStream and LocaliQ's 2025 Facebook benchmarks, drawn from 554 traffic and 726 leads campaigns in the United States between April 2024 and June 2025 and reported as medians, put the average cost per lead at $27.66, up 20.94% year over year, while the average cost per click for traffic campaigns fell 6.67% to $0.70. The headline that should stop you cold is the spread across verticals: cost per lead ranged from $3.16 for restaurants and food to $76.71 for dentists. A restaurant and a dental clinic running identical ROAS targets would be making opposite business decisions. No single good ROAS for Facebook can survive a 24-fold gap in the cost of a result.
Channel matters too. The same WordStream data, as Search Engine Land reported in September 2025, put Facebook's $27.66 cost per lead well under Google's $70.11. Cheaper leads mean a Facebook prospecting campaign should not be held to the ROAS you would expect from branded search, where the buyer already knows you. Comparing the two as if they were the same channel is how good campaigns get killed.

A good ROAS when there is no sale: lead generation
Plenty of Facebook advertisers never see a purchase on the platform at all. If you run lead generation for a service, a B2B pipeline, or a high-ticket booking, the dashboard has no revenue to divide by spend, so Purchase ROAS is blank or close to it. The same logic still applies. You just translate it into a cost per lead you can afford.
Work backwards from the deal. Take the gross profit you keep on a closed deal and multiply it by the rate at which leads turn into customers. If a won deal is worth $1,000 in gross profit and you close 5% of the leads you generate, each lead is worth $50 in expected profit ($1,000 times 0.05). That $50 is your break-even cost per lead: pay more and you lose money on average, pay comfortably less and you are in profit. It is the lead-gen twin of break-even ROAS, built from the same two inputs, value and conversion.
Now the benchmarks have a use. WordStream and LocaliQ put the average Facebook cost per lead at $27.66 in their 2025 data, with a spread from $3.16 for restaurants to $76.71 for dentists. If your math says $50 a lead breaks even and the platform is delivering leads at $28, you have room to scale. If your break-even is $20 and leads cost $40, no audience change rescues that, the offer or the funnel has to improve. An average cost per lead means nothing until you set it against the number your own close rate can carry.
The 2026 measurement shift you cannot ignore
Even a correct break-even number is only as good as the revenue figure feeding the ROAS, and in 2026 that figure changed underneath everyone. Meta removed the 7-day-view and 28-day-view attribution windows from its Ads Insights API on January 12, 2026, a change Supermetrics documented from Meta's Developer Blog announcement in October 2025. The current default per Meta's documentation is 7-day click plus 1-day view. The practical consequence is blunt: a ROAS your account reported a year ago on a longer view window is not directly comparable to one reported today, because the longer window credited view-through conversions the new default does not. If your ROAS appeared to drop in early 2026 without any change to your ads, this is the first place to look. The ad did not get worse, the ruler got shorter.
The other half of the measurement problem is your own setup. Reported ROAS is only as complete as the conversions you capture, and a tracking gap silently deflates it: a profitable campaign can look like a loser purely because events are going missing. Meta positions the Meta Pixel (the rebranded Facebook Pixel) alongside the Conversions API, server-side events sent from your own backend, as the durable measurement layer. A pixel-only setup that drops events in the browser undercounts revenue and makes your ROAS read lower than the campaign earned. Before you ever conclude a campaign is failing, confirm the measurement is intact. Reading Purchase ROAS and checking which attribution window you are on is the first diagnostic, and it is faster than rebuilding a campaign that was never broken.
Why your blended ROAS is lower than the dashboard
The measurement section above is about under-counting: a tracking gap hides revenue and makes ROAS read low. There is an opposite failure that hits the moment you run more than one channel, and it makes ROAS read high. Platform-reported ROAS is Meta's own attributed number, credited on its default 7-day-click, 1-day-view window. It counts every conversion that window can reach, whether or not another channel also touched that buyer. Run Meta alongside search, email, and an influencer push, and each platform reports a ROAS on its own attribution. Those windows overlap, so two or three of them can claim credit for the same sale. Add the platform ROAS figures together and they describe more revenue than your bank actually received.
The fix is your blended ROAS: total revenue divided by total ad spend across every channel. Because it starts from the real money your store booked, not from any platform's attributed estimate, it cannot double-count. It is the one figure that reconciles the dashboards against reality. Shopify frames a broader cousin, the marketing efficiency ratio (MER), as total revenue divided by total marketing spend, which folds in organic traffic, branding, and influencer work alongside the ads. Whichever you watch, the discipline is the same: judge the whole engine against the money your bank actually received, not against any single platform's attributed number.
| Platform-reported ROAS | Blended ROAS | |
|---|---|---|
| Revenue source | Meta's attributed conversions, on its own click and view window | Actual total revenue from your own accounting |
| Scope | One channel, one campaign | Every channel and campaign together |
| Failure mode | Over-counts when channels share credit for a sale | Cannot double-count; starts from money received |
| Use it to | Compare campaigns inside Meta | Judge whether marketing as a whole pays |
Use Meta's ROAS to compare ads against each other inside the account. Use the blended number as the north star for whether the marketing engine is profitable overall. When platform ROAS looks strong but your blended ROAS stays flat, your channels are quietly taking credit for each other's sales.
Read the number with enough data, and over enough time
A ROAS reading is only as trustworthy as the volume behind it. A 5x return on six sales is noise, not a result: one refund or one lucky day swings it by a point. Meta's own delivery has the same problem, which is why an ad set needs about 50 optimization events within 7 days to leave the learning phase, per Meta's Business Help Center. Below that bar the system is still guessing, and so is your ROAS. Killing a campaign on three conversions, or pouring budget into a 7x built on eight sales, are the two most common ways the headline number misleads.
Time distorts it too. The 7-day-click window means today's spend keeps booking revenue for a week, so a same-day ROAS reads artificially low and tempts you to switch off ads that simply have not finished converting. On top of that, results swing week to week and lift hard in seasonal peaks such as the Q4 run-up, for reasons that have nothing to do with whether the ad is good. So read ROAS as a trend line over weeks, not a daily snapshot. A single bad day is rarely fatigue. A return that drifts down week after week at steady spend usually is, and that falling line, not any one reading, is the signal to refresh the creative.
What actually moves ROAS (and what does not)
ROAS lives downstream of three numbers: click-through rate, conversion rate, and average order value. The same spend yields a higher ROAS when the creative earns more clicks, the landing page converts more of them, or the basket is bigger. That chain is the whole reason a weak ROAS is almost never an audience problem. Swapping the interest stack changes who sees the ad, but it does nothing about a hook that does not stop the scroll or a page that does not close the sale.
The 2025 benchmarks size the levers. WordStream put the average Facebook click-through rate for traffic campaigns at 1.71%, up from 1.57% the year before, and the average landing-page conversion rate for leads campaigns at 7.72%, slipping from 8.67%. Those are the two dials that feed ROAS most directly, and both are creative and offer decisions, not targeting ones. A higher click-through rate feeds a higher ROAS because every extra click is revenue at no extra cost per impression, and the hook is the cheapest ROAS lever you have because it is the one thing you can change in an afternoon.
There is one more reason audience-swapping has faded as the first move. Meta's targeting has largely folded into Advantage+ audience, where the system suggests an audience and you add hints or exclusions rather than building interest stacks from scratch. Meta also renamed Advantage+ Shopping Campaigns to Advantage+ Sales campaigns in February 2025, per Social Media Today, with new sales campaigns defaulting to the Advantage+ on setup. Meta reports favourable results for these products in its own marketing, lower cost per qualified lead with Advantage+ enabled among them, but those are Meta's own claims, not neutral benchmarks, so weigh them as directional. The takeaway stands either way: when the machine is already choosing the audience, the audience is rarely the variable left for you to fix.
Can you just set a ROAS target in Meta?
A fair question, since Meta does let you. Its ROAS goal bid strategy, part of value optimization, takes a target return and tells delivery to bid only when it predicts the result will clear that line, per Meta's Business Help Center. You set the number, the system aims to stay at or above it.
The catch is the data it needs. ROAS goal runs on value optimization, so your Meta Pixel or dataset has to pass a purchase value back on every sale, not just the fact that a purchase happened, and Meta needs a steady flow of those valued conversions before the option is even available. If your tracking does not send values, you will not see the strategy. Sending clean, valued conversions through the Conversions API is the prerequisite, not an afterthought.
And it is a guardrail, not a magic number. Set the target too high and Meta simply stops bidding on impressions it cannot clear, so delivery stalls and the budget goes unspent. The strategy optimises toward your goal; it cannot manufacture demand that is not there. Feed it a target anchored on your real break-even, set a touch below the return you actually want, and let the creative do the work of getting there.
The honest fix for a below-target ROAS
So your ROAS is under your break-even line. The reflex is to open a new audience. The discipline is to do three things first, in order.
Confirm the tracking. Check that your Pixel and Conversions API are firing and that the attribution window you are reading is the one you think it is, because the 2026 change quietly reset the baseline. A measurement gap is the single most common reason a profitable campaign reads as a failure, and it costs nothing to rule out.
Recompute the break-even. Margins drift as costs of goods, shipping, and fees move, and a target set six months ago may be wrong now. If your real break-even is 2.5x and you have been panicking about a 2.8x, there is nothing to fix.
Then, and only then, sharpen the creative. Test a new angle against your current best ad: a different hook, a different proof, a different offer framing, judged head to head. This is where average order value and lifetime value come back into play. Befree advertises an eye-health drink at RM20 for new buyers, a deliberately low first-order price that only pays off if repeat purchases make the lifetime math work, so the right ROAS bar for that first order is lower by design. Shakura runs a before-and-after offer at RM68 for two sessions, a repeat-service category where a stronger before-and-after creative, not a fresh audience, is what lifts the return. The prices illustrate the mechanics rather than any live campaign, but both point the same way: when ROAS lags, the next thing to change is the ad, not the targeting.
This is where keeping research, creative generation, editing, and Meta launch in one workflow earns its place, because the fix for a weak ROAS is a faster loop from a winning angle to the next test, not a fresh interest stack. A platform like AdPlay.ai keeps that loop in one tab. The principle holds regardless of the tools: study what is already working (the free Meta Ad Library is a good start), test a sharper angle rather than a new audience, and watch for falling ROAS over time, which is often fatigue rather than a bad audience.
Putting a real ROAS target on your account
There is no good ROAS for Facebook ads that you can copy from a chart, but there is a clear way to set yours. Start from your margin and compute the break-even (1 divided by margin). Decide whether you are buying profit now or buying customers for later: if repeat purchase is strong, you can run a lower first-order target and recover on lifetime value; if it is thin, the first order has to pay for itself. Separate prospecting from retargeting so the cold campaigns are judged against break-even and not flattered by warm demand they did not create. Then read the number against neutral, dated benchmarks for cost per click and conversion rate, never against a vendor average with no method behind it.
Meta's advertising business reached roughly $196 billion in revenue in 2025, up about 22% year over year per its full-year 2025 results, which is a reminder that you are bidding against more spend every year, and the auction does not get cheaper. The lever that compounds in your favour is not a better-targeted audience. It is a better ad against a number you actually understand. If you are still setting up the campaign that ROAS will be measured against, pick the objective and conversion event first, and if you are earlier than that, the full beginner path comes before you obsess over the scoreboard at all.
By the numbers
Frequently asked questions
What is a good ROAS for Facebook ads?
A good ROAS is any return above your own break-even, which equals 1 divided by your profit margin (after the cost of goods, shipping, payment fees, and the ad spend itself). As a rough goalpost, the Corporate Finance Institute treats around 4:1 as strong for thin-margin e-commerce, 2:1 as enough for a high-margin business, and 1.5:1 as acceptable while you deliberately scale. A 5x ROAS on a thin-margin product can be losing money, and a 2x on a high-margin one can be thriving, so the only target that means anything is your break-even.
What is the average ROAS for Facebook ads in 2026?
There is no reliable neutral average. The 2-3x figures that circulate almost all come from advertising-tool vendors measuring their own customers, not independent studies, so treat them as a loose goalpost rather than a benchmark. The comparison got even harder in 2026: Meta removed the 7-day-view and 28-day-view attribution windows from its Ads Insights API on January 12, 2026, so a ROAS measured on the old longer windows is not directly comparable to one measured today. Anchor on your break-even and on neutral, dated cost benchmarks instead.
What is MER (marketing efficiency ratio), and why is my blended ROAS lower than my dashboard?
Your blended ROAS is total revenue divided by total ad spend across every channel; the marketing efficiency ratio (MER) is the broader figure Shopify defines as total revenue divided by total marketing spend, which also captures organic traffic, branding, and influencer work. Either one is usually lower than the ROAS Meta shows because the platform number is Meta's own attributed estimate: when you run several channels, their attribution windows overlap and more than one platform claims credit for the same sale, so the platform ROAS figures added together describe more revenue than your bank received. A blended figure cannot double-count because it starts from the real money your store booked. Use platform ROAS to compare campaigns inside Meta, and use the blended number to judge whether marketing as a whole is profitable.
What is the difference between ROAS and ROI?
ROAS uses revenue, the top line, while ROI or profit uses what is left after the cost of goods, shipping, fees, and the ad spend. That gap is why a 3x ROAS can still lose money on a thin-margin product. ROAS tells you how hard the advertising is working; only ROI tells you whether the business is making money. Use ROAS to compare campaigns, and use break-even ROAS (from your margin) to decide whether any of them is actually profitable.
What is break-even ROAS and how do I work mine out?
Break-even ROAS is the return where revenue exactly covers your costs, calculated as 1 divided by your profit margin. A 50% margin breaks even at 2.0x, a 40% margin at 2.5x, a 25% margin at 4.0x, and a 20% margin at 5.0x. Anything above that line is profit, anything below it means you are paying to lose money. Compute your margin after the cost of goods, shipping, payment fees, and returns, not as a gross markup, or you will set the bar too low.
Why is my retargeting ROAS so much higher than my prospecting ROAS?
Because retargeting harvests demand you already paid to create. Those people met your brand through a prospecting ad, so the retargeting campaign collects credit for sales the cold campaign warmed up. Blending both into one campaign ROAS hides which half is doing the work. Judge prospecting against your break-even, not against your retargeting number, and judge retargeting on the incremental sales it adds rather than the ones it would have got anyway.
Should I judge ROAS on the first purchase or lifetime value?
It depends on whether customers come back. If your repeat-purchase rate is healthy, the first order does not have to pay for itself: you can model a lifetime-value ceiling and accept a lower first-purchase ROAS, recovering the rest on repeats. The cleaner way to judge this is the lifetime-value-to-acquisition-cost ratio, where HubSpot treats roughly 3:1 as healthy, plus your payback period, the months it takes repeat revenue to recover the acquisition cost. If repeat rate is thin, make the first order break even on its own and treat any repeats as a bonus. The mistake is assuming high lifetime value before the data shows it, then scaling on a first-order ROAS that never actually pays back.
My ROAS is below target, should I change the audience?
Usually not first. ROAS sits downstream of click-through rate, conversion rate, and average order value, so a weak number is most often a creative, offer, or landing-page problem rather than an audience one. Confirm your tracking is intact (a measurement gap deflates ROAS on its own), recompute your break-even, then test a sharper creative angle against your current best ad. Reflexively opening a new interest stack rarely fixes a ROAS that the creative is dragging down.
Sources
- 1.Corporate Finance Institute, Return on Ad Spend (ROAS) Guide (2025)
- 2.WordStream / LocaliQ, Facebook Ads Benchmarks 2025 (2025)
- 3.Search Engine Land, Facebook Ad Costs Jump, Still Beat Google (2025)
- 4.Supermetrics, Facebook Ads Attribution Window and Metric Removals (Jan 12, 2026) (2026)
- 5.Social Media Today, Meta Advantage+ Ad Updates (2025)
- 6.Meta Platforms, Fourth Quarter and Full Year 2025 Results (2026)
- 7.Shopify, Marketing Efficiency Ratio (MER): How to Calculate and Improve It (2026)
- 8.Corporate Finance Institute, Gross Margin Ratio (2025)
- 9.HubSpot, What Is a Good LTV to CAC Ratio? (2026)
- 10.Meta Business Help Center, About the Learning Phase (2026)
- 11.Meta Business Help Center, About ROAS Goal (2026)
Keep exploring
Turn ad research into winning ads
Research the ads that work, generate the creative on-brand, and launch to Meta, all in one tool.
7-day free trial · No credit card required