
Thumbstop Ratio: Stop the Scroll in 3s (2026)
What thumbstop ratio is, how to calculate it, the benchmark to aim for, and how the first frame, thumbnail, and overlay move it without a reshoot.
Updated September 2026 · Likit Sae Lee, CTO

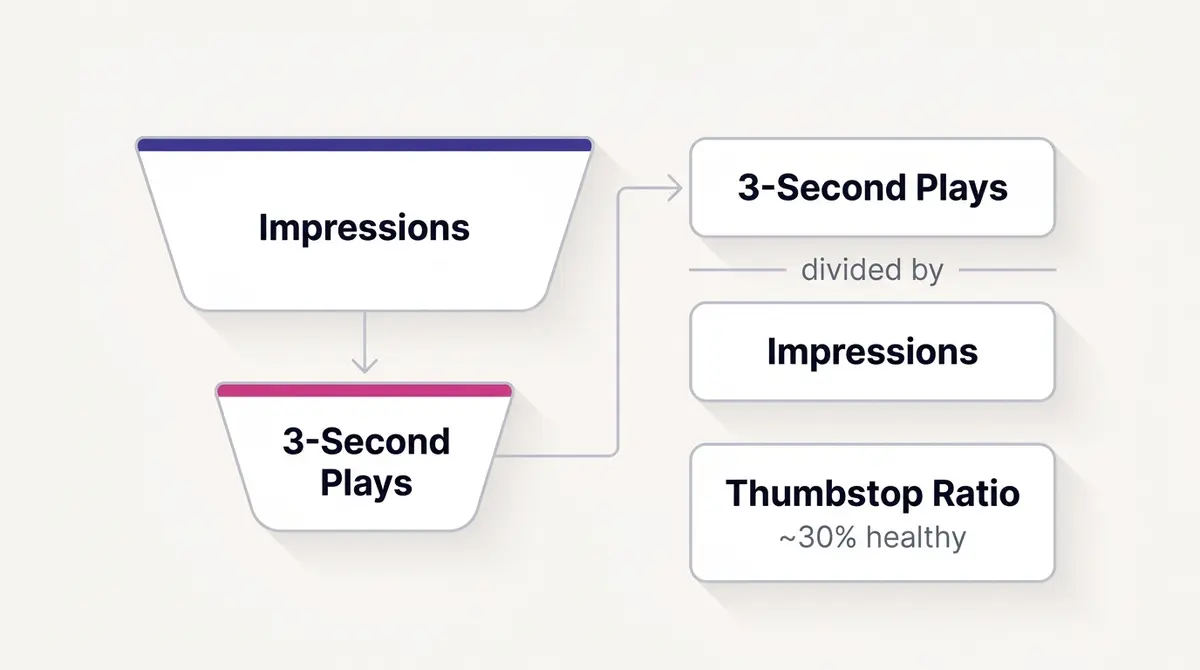
Thumbstop ratio is 3-second video plays divided by impressions (250 plays on 1,000 impressions is 25%), a custom metric you build in Ads Manager because Meta does not report it natively. Many advertisers sit in the high teens to low twenties, while around 30% or higher is a healthy directional target per a 2025 agency report on $28.7M of spend. The same agency lifted one ad from 19.15% to 42.48% just by delaying the product reveal, no reshoot, proving the opening seconds, thumbnail, and text overlay are the real levers.
You paid for the impression the moment your ad entered the feed. Whether anyone actually watched is a separate question, and the gap between those two is where most video budgets quietly leak. Thumbstop ratio measures exactly that gap: of all the people Meta showed your ad, how many stopped long enough to register it. It is the single number that tells you if your opener is doing its job, and the good news is that it moves on the first 1.5 seconds, not the whole production.
What thumbstop ratio actually measures
Thumbstop ratio answers one question: of everyone Meta showed your ad to, how many stopped scrolling long enough to register it. The formula is simple and agreed across every serious source: 3-second video plays divided by impressions. Per Smart Marketer's 2025 Facebook Ads Report, built from $28.7M of real spend over twelve months, that is exactly how agencies define it.
The arithmetic is just as plain. If Meta served your ad 1,000 impressions and 250 of them turned into 3-second video plays, your thumbstop ratio is 250 divided by 1,000, which is 25%. That is the whole calculation: one column divided by another, expressed as a percentage. Keep the percentage in mind, because the most common stumble when you build this yourself is a column that reads 0.25 instead of 25%, covered in the measurement section below.
The important catch is that Meta does not hand you this number. Ads Manager reports 3-second video plays and impressions as two separate columns, but never their ratio. You build it yourself as a custom metric in Ads Manager, dividing the two, and from then on it appears as a column you can sort and segment. Many analytics tools label the same formula hook rate, which is worth knowing because the two terms are interchangeable.
The numerator is precise. Per Meta's own definition, a 3-second video play is counted each time your video plays for at least 3 seconds, or for close to its full length if the clip is shorter than 3 seconds. It is counted per impression and excludes replays. So thumbstop ratio is not a vanity view count; it is the share of paid impressions that earned three seconds of a real human's attention. Everything else in your video funnel sits downstream of that first decision.
What a good thumbstop ratio looks like in 2026
Here is where a lot of online glossaries overreach. You will see confident claims of a precise average band and a precise healthy line. The honest version is softer. The most defensible, verifiable figure comes from Smart Marketer's agency report: around 30% is a good starting benchmark, with the explicit caveat that it varies greatly by industry. Treat that as directional, vendor-sourced guidance, not a law.
In practice, many advertisers sit in the high teens to low twenties, while roughly 30% or higher is a healthy target to push toward. The most useful anchor is a real example rather than an average. The same agency report documents one ad moving from a 19.15% thumbstop rate to 42.48% with the same product and the same audience. That single case book-ends the realistic range: the high teens is where a weak opener lives, and the low forties is what a strong one looks like.
| Thumbstop band | What it usually signals |
|---|---|
| Below ~15% | The opener is invisible in the feed. Most paid impressions never become a real view. |
| High teens to low twenties | Common, workable, but the first seconds have clear room to climb. |
| ~30% and up (directional) | A healthy target per agency data; the opener is doing its job. |
| ~40%+ | A genuinely scroll-stopping opener; rare and worth studying. |
Because the average is so industry-dependent, the single most reliable benchmark is your own account history. Build the custom metric, let it run across a dozen ads, and your median becomes the line you optimize against. An ad five points above your account median is a winner regardless of what any external glossary claims.
Creative style moves that baseline as much as quality does, which is the real reason a single industry average is so slippery. A raw, native-looking opener that resembles organic content posts a different thumbstop than a polished motion-graphic or brand-film opener, because the feed reads the two as different kinds of content before a viewer judges either. Placement mix shifts it again: an account running mostly vertical video in Reels will not share a baseline with one running studio video in Feed. So a number borrowed from someone else's account, or from a glossary that does not say what style or placement produced it, tells you almost nothing about your own ad. For a wider read on how these paired attention metrics fit together, see the hook rate benchmark guide, and the full Facebook ad metrics map shows where thumbstop sits among the numbers that decide whether a campaign works.
Why the opening seconds set the ceiling
The reason thumbstop earns so much attention is that retention compounds from it. Figures attributed to Facebook and reported by Marketing Essentials Lab describe a steep drop-off: of people who watch the first 3 seconds, roughly 65% reach the 10-second mark, and 45% of those reach 30 seconds. Stack those together and the math is unforgiving. If a thousand people see your ad and only 200 clear three seconds, then roughly 130 reach ten seconds and around 58 reach thirty. The opener does not just affect the start of your funnel; it sets the ceiling on every stage after it.
That is why a weak thumbstop ratio is so expensive. WordStream's 2025 benchmarks put the average Facebook Ads CPC for a Traffic objective at $0.70 with a 1.71% CTR, and the Leads objective CTR at 2.59%, all USD medians across hundreds of campaigns. Those are feed-engagement numbers, and they only have a chance to fire if someone watched first. Every impression you paid for that died inside the first three seconds is spend with no shot at the click, the lead, or the sale.
It also explains why thumbstop is the lever worth pulling rather than chasing organic reach. Socialinsider's 2025 benchmarks put average Facebook organic engagement across all formats around 0.15% and average Instagram Reels views for 60-90 second clips near 5,400. Organic distribution is thin and unpredictable; the paid thumbstop number is something you directly control. You cannot make the algorithm love you, but you can make a person stop.
There is a feedback loop here too. Meta's delivery system reads early engagement signals when it decides how widely and how cheaply to distribute your ad. A video that holds attention in the first seconds tends to earn more efficient delivery, which compounds the savings. So a strong thumbstop ratio is not only the start of a healthier funnel; it nudges your cost structure in the right direction before the click ever happens. The reverse is also true: a video that everyone scrolls past teaches the system that your ad is weak, and weak ads get more expensive to deliver. That delivery feedback loop is one quiet reason a poor opener inflates your CPM on top of wasting the impression you already paid for.
Hold rate: where thumbstop hands off
Thumbstop tells you the scroll stopped. It says nothing about what happened next, and that is where its partner metric comes in. Hold rate measures whether the people who stopped actually stayed. A common way to build it is ThruPlays divided by 3-second video plays, formatted as a percentage, so it reads as the share of your scroll-stoppers who held to completion or to 15 seconds. ThruPlay counts a video watched to completion when it is 15 seconds or shorter, or watched for at least 15 seconds otherwise, so hold rate is a depth-and-retention number where thumbstop is a top-of-feed attention number. Like thumbstop, Meta does not report hold rate natively. You build it the same way, as a custom metric, and read it against your own account median rather than any borrowed benchmark, because the published hold-rate figures floating around come from vendor blogs, not a neutral primary source.
The reason to track both is that together they tell you exactly what to fix. Read them as a simple grid.
| Strong hold rate | Weak hold rate | |
|---|---|---|
| Strong thumbstop | The opener stops the scroll and the body keeps them. Scale it and study why it works. | The first frame earns the stop, then the body loses people. Fix the pacing, the payoff, or the length, not the opener. |
| Weak thumbstop | The body would hold viewers, but almost nobody gets there. Fix the opener first; the hard work downstream is being wasted. | Neither end works. Retire the concept and test a genuinely new angle instead of tweaking this one. |
The order matters. Always fix a weak thumbstop before you touch the body, because a brilliant middle is invisible if the scroll never stops. Only once the opener is earning stops does a weak hold rate become the next thing worth rebuilding. For the full picture of where both metrics sit among everything else Ads Manager reports, the Facebook ad metrics guide maps the whole set.
The three levers that move the number
The opener is not the whole video, and that is the point. Three editable elements decide most of your thumbstop ratio, and none of them requires a reshoot.
The first 1.5 seconds carry the heaviest weight. The scroll-stop decision happens almost instantly, so the question is what fills the frame the moment your ad appears. A logo card, a slow fade-in, or a branded intro animation is dead weight here; the viewer is gone before your message arrives. Leading with motion, a human face, or a concrete problem state stops the thumb far more reliably than a polished brand opener.
The thumbnail is the second lever, and it matters more than most advertisers realize. For autoplay-muted placements and for the still frame shown before play, the thumbnail is effectively your first impression. A static brand card loses to a frame with movement, tension, or a face mid-expression. Swapping the thumbnail alone can shift the 3-second-play count noticeably because it changes what the resting eye registers.
The opening text overlay is the third. A short, legible overlay in the first second can carry the hook for the majority of viewers watching with sound off. A curiosity question or a sharp problem statement on the first frame gives the scroll a reason to pause before the product ever appears. The strongest proof of all three working together is the agency case already mentioned: delaying the product reveal and front-loading the hook lifted one ad from 19.15% to 42.48%, a 121% jump on the same footage.
| Lever | What to change | Reshoot needed |
|---|---|---|
| First 1.5 seconds | Cut the logo intro; open on motion, a face, or a problem | No, re-edit existing footage |
| Thumbnail | Swap the still frame to one with movement or expression | No |
| Opening overlay | Add a curiosity question or problem line on frame one | No |
| Product reveal timing | Delay the product until after the hook lands | No, re-sequence clips |
| Vertical framing | Keep the hook text and key visual in the central safe area on 9:16 | No, reframe the export |
There is a fourth lever hiding inside the third, and it only bites on vertical placements. Meta recommends a 9:16 aspect ratio for full-screen Reels and Stories, and on those placements the platform layers its own interface over the top and bottom of the frame: the profile name and audio strip up top, the caption and call-to-action button along the bottom. If your hook text or your most arresting visual sits in those bands, the very thing meant to stop the scroll is hidden behind the app's own UI, and your thumbstop quietly caps no matter how strong the opener is. The fix costs nothing on existing footage. Keep the hook text and the key visual inside the central safe area, clear of the top and bottom edges, and the same first frame works across Reels and Stories without anything important getting clipped.
Hook-first openers in practice
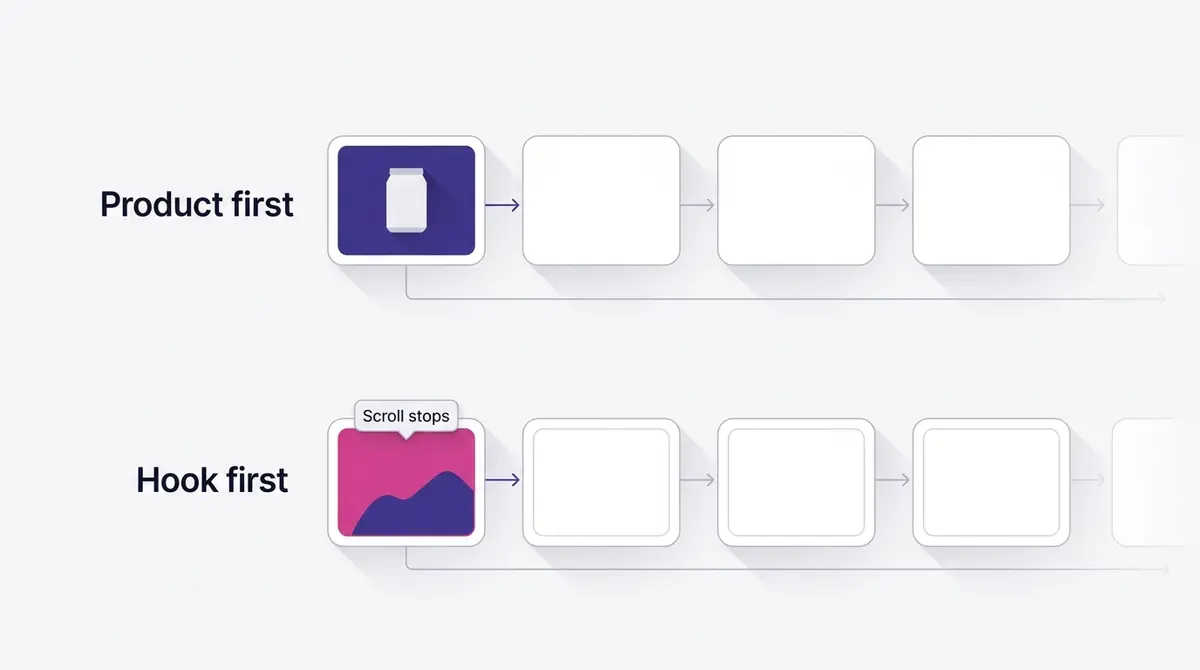
The pattern that consistently raises thumbstop is hook-first rather than product-first. The product still appears; it just waits until after the opener has earned attention. Skincare and fitness creative make this easy to see because the before state is inherently more arresting than the bottle.
A brand like Medicube runs a how-to or demo ad for a bare-skin close-up that fills the first frame before any logo appears, naming the pore or texture concern in a text overlay so the viewer recognizes their own face on screen. A brand like Skinlycious runs a curiosity-hook UGC ad for a fading-spot question posed over the first frame, so the scroll stops on the question before the product shows up around five to seven seconds in. Both delay the reveal on purpose, which is the exact move that lifted the agency case study's number.
The thumbnail test is just as concrete. A brand like Shakura runs a before and after ad for a brightened-skin reaction tested against a product shot as the opening frame: two first frames, same video, and you keep whichever earns the higher 3-second-play rate. A fitness advertiser can lead with a mid-rep action still as the thumbnail instead of a brand card, so the resting frame already implies motion. None of these require a camera; they require choosing a better first frame from footage that already exists.
How to build and read the metric correctly
Start by building the custom metric. In Ads Manager, open the Columns dropdown, choose Customize Columns, then Create Custom Metric. Name it thumbstop ratio or hook rate so you recognize it later, and set the formula to 3-second video plays divided by impressions. Here is the step most people miss: set the format to Percentage, so the column reads 25% rather than the raw 0.25 decimal that trips up first-timers. Save the metric, then save your whole column layout as a preset, so the column persists across every report instead of vanishing the next time you switch views.
Then resist judging it as a single account-wide number. Break it down by placement, because a Reels-first audience scrolls differently from a Feed audience and the same opener can swing widely between them. Segment by audience temperature too, and know why the two diverge. On a warm retargeting pool, brand recognition does most of the stopping: people who already know you pause when your logo or product appears, so the thumbstop climbs without the opener being any stronger. A retargeting number that sits well above your cold prospecting number is expected, and it is not evidence of a great hook. Judge openers on their cold prospecting thumbstop, where the creative has to earn the stop from a stranger, and never average cold and warm together, because the blend hides which opener is actually working.
Keep thumbstop in its lane. It measures attention, not intent. A shocking or misleading opener can spike the 3-second-play rate and still tank downstream, so always read thumbstop next to CTR and cost per result. The pairing is the whole point: thumbstop tells you whether the opener stopped the scroll, and your click-through rate tells you whether it stopped the right person for the right reason. An ad with strong thumbstop and weak CTR is winning attention and losing the message; an ad weak on both is a dead opener.
| Metric | What it tells you | When it is a problem |
|---|---|---|
| Thumbstop ratio | Did the opener stop the scroll | Low: the first frames are invisible |
| ThruPlay | Did viewers hold to completion or 15s | Low: the body loses people after the hook |
| CTR | Did the right person want to act | Low with high thumbstop: wrong promise |
| Cost per result | Did attention turn into outcomes | High: attention is not converting |
One note on the 2026 landscape. With a large majority of Meta advertisers now leaning on Advantage+ automation in some form, more of the targeting is handled for you, which only raises the stakes on the creative you feed it. Advantage+ creative can auto-adjust variations, but it cannot invent a stronger hook than your footage allows. The opener is still your job.
Common reasons thumbstop stays low
When the number refuses to move, the cause is usually one of a handful of repeat offenders, and naming them shortens the diagnosis.
The most common is a slow start. Establishing shots, brand stings, and gentle fade-ins feel professional in a review meeting and die in the feed, where the viewer has already decided to scroll before the scene resolves. The fix is to cut to the most arresting frame and lead with it.
The second is a product-first opener. Showing the bottle, the gadget, or the packshot in frame one assumes the viewer already cares, which a cold audience does not. The agency case proves the alternative: the same product converted far better once the reveal was delayed and a hook earned the attention first.
The third is an illegible or absent overlay. With most feed video watched on mute, a hook that lives only in the voiceover never lands. If your opener depends on sound, your thumbstop ceiling is capped by however few people have sound on.
The fourth is a thumbnail mismatch. The still frame Meta picks by default is rarely your strongest, and if it shows a static, low-contrast moment, the resting eye registers nothing worth stopping for. A deliberate thumbnail choice is one of the cheapest wins available.
The fifth is mixing audiences. A cold prospecting set and a warm retargeting set produce very different thumbstop numbers, and a blended report hides which opener is actually working. Segment before you conclude an opener has failed.
Turning a weak opener into a winner
The workflow is short because the fix is editorial, not productional. Pull your worst-performing videos by thumbstop ratio. For each, ask one question: what fills the first 1.5 seconds, and is it earning the stop or wasting it. Most weak openers fail the same way, with a logo intro, a slow establishing shot, or the product front and center before anyone cares.
Then re-edit, do not reshoot. Cut the intro so the video opens on the strongest frame in the footage. Add a one-line overlay that names the problem or asks the curiosity question. Swap the thumbnail to the frame with the most motion or expression. Delay the product reveal until the hook has had a couple of seconds to land. Every one of these changes works on existing clips, which is precisely why the agency case moved 23 points without a camera.
This is where a real video and image editor earns its place. Inside AdPlay.ai you can trim the first frame, swap the thumbnail, restyle the opening overlay, and relaunch the variant straight to Meta, so testing a scroll-stopping opener is a same-session edit rather than a new production cycle. From there, treat openers like any other variable in creative testing: ship two or three first-frame variants of the same video, let thumbstop ratio pick the winner, and roll the learning into your next hook. When you write the next opener from scratch, a hook-first script template keeps the reveal where it belongs, after the hook has earned the stop. The video you already paid to make almost always has a better opener hiding three seconds in. Your job is to find it and put it first.
Example ad angles
Representative hooks and formats from the category.
“How-to or Demo ad for a bare-skin close-up that fills the first frame before any logo appears”
“Before and After ad for a brightened-skin reaction tested against a product shot as the opening frame”
“Curiosity Hook ad for a fading-spot question posed over the first frame before the product shows”
By the numbers
Frequently asked questions
What is a good thumbstop ratio in 2026?
Treat around 30% as a healthy starting target, per a 2025 agency report covering $28.7M of ad spend, and read that figure as directional rather than a hard line. Many advertisers sit in the high teens to low twenties, so anything in that band is workable but has room to climb. The number varies a lot by industry, format, and audience temperature, so compare an ad against your own account history before judging it.
Is thumbstop ratio a native Meta metric?
No. Meta reports 3-second video plays and impressions separately, but it does not show their ratio. You build thumbstop ratio yourself as a custom metric in Ads Manager: 3-second video plays divided by impressions. It is also called hook rate in many analytics tools, which is the same formula under a different name.
What counts as a 3-second video play?
Per Meta, a 3-second video play is counted each time your video plays for at least 3 seconds, or for close to its full length if the video is shorter than 3 seconds. It is counted per impression and excludes replays. That count is the numerator of your thumbstop ratio.
What is hold rate, and how is it different from thumbstop ratio?
Hold rate measures whether the video keeps people after the opener, where thumbstop measures whether the opener stopped them at all. A common way to build it is ThruPlays divided by 3-second video plays, formatted as a percentage, so it reads what share of the people who stopped actually held to completion or to 15 seconds. Like thumbstop, Meta does not report it natively, so you build it as a custom metric and read it against your own account median. Thumbstop diagnoses the first frame; hold rate diagnoses the body.
My hook rate is weak but hold rate is strong, or the reverse: which do I fix first?
Fix the opener first whenever thumbstop is weak, because a strong body never gets seen if the scroll does not stop. If thumbstop is strong but hold rate is weak, the first frame is working and the middle is losing people, so rework the pacing, the payoff, or the length of the body. If both are strong, scale the ad. If both are weak, retire the concept rather than tweaking it. The two metrics together tell you which part to rebuild.
Can I improve thumbstop without reshooting the ad?
Often yes. The fastest gains come from the first frame, the thumbnail, and the opening text overlay, all of which you can edit on existing footage. A 2025 agency example lifted one ad from 19.15% to 42.48% purely by delaying the product reveal, with no new shoot. Swapping the opener and relaunching is usually faster and cheaper than producing new creative.
Does a high thumbstop ratio guarantee sales?
No. Thumbstop measures attention, not intent. A shocking or confusing opener can stop the scroll and still fail to convert. Read thumbstop alongside downstream metrics like CTR and cost per result so you catch openers that win attention but lose the sale.
Why is my thumbstop ratio higher on retargeting than on cold prospecting?
Because brand recognition does the stopping on a warm audience, not creative strength. People who already know you pause when they see your logo or product, so a retargeting pool can post a much higher thumbstop than cold prospecting on the very same video. That makes a blended report misleading: a strong retargeting number is not proof the opener works on strangers. Judge an opener on its cold prospecting thumbstop, where the creative has to earn the stop on its own.
Sources
- 1.Smart Marketer, 2025 Facebook Ads Report Part 1 (2025)
- 2.Meta Business Help Center, About video metrics for ads (2025)
- 3.Metric Labs, ThruPlays (Facebook metrics glossary) (2024)
- 4.Marketing Essentials Lab, The Three-Second Social Media Rule (2021)
- 5.Socialinsider, 2025 Social Media Video Performance Benchmarks (2025)
- 6.Socialinsider, Facebook Engagement Rate Benchmarks 2025 (2025)
- 7.WordStream, Facebook Ads Benchmarks 2025 (2025)
- 8.Meta Business Help Center, Create custom metrics in Meta Ads Manager (2026)
- 9.Meta Business Help Center, Best practices for aspect ratios across placements (2026)
Keep exploring
Turn ad research into winning ads
Research the ads that work, generate the creative on-brand, and launch to Meta, all in one tool.
7-day free trial · No credit card required