
10 Facebook Ad Metrics That Matter (2026)
The ten Facebook ad metrics that tell you what to fix next, each with a one-line definition, a 2025 benchmark, and where to dig deeper.
Updated August 2026 · Likit Sae Lee, CTO

The ten Facebook metrics worth acting on are CPM, CTR, CPC, cost per result, ROAS, frequency, hook rate, hold rate, conversion rate, and reach versus impressions. Anchor them to 2025 benchmarks: CPM averaged $8.19 (Gupta Media), traffic CTR ran 1.71% and leads CTR 2.59% (WordStream), and the average Facebook cost per lead was $27.66 (WordStream). Read them as a chain, not a scoreboard: each metric points at one place where the funnel leaks, from the auction price down to the offer.
Ads Manager shows you forty columns and lets you obsess over the wrong one. A pretty CTR hides a dead landing page; a scary CPM hides a campaign that prints money. The skill is not reading every number, it is knowing which ten metrics tell you what to change next, in what order, and what counts as normal in 2026. This is the map: each metric gets a one-line definition, a benchmark you can trust, and a pointer to the deeper guide when you want to fix it.
How the ten metrics connect
Most reporting mistakes come from reading metrics in isolation. A 0.4% CTR looks like a disaster until you see it sitting on top of a 9% conversion rate and a profitable cost per result. The ten metrics that matter form a chain, and money leaks at exactly one link at a time. Read them in order and the column you need to fix announces itself.
The chain runs from the auction down to the sale. CPM is the price Meta charges to show your ad. CTR, and underneath it hook rate, decide whether that impression earns a click. CPC is what that click costs. Conversion rate decides whether the click becomes a result. Cost per result is the sum of all that upstream behaviour, and ROAS converts it into profit. Frequency and reach versus impressions sit alongside the chain as health checks on the audience. Skip none of them and you stop guessing.
There is a reason to learn the order rather than memorise the numbers. When a campaign underperforms, the instinct is to change targeting, because targeting feels like the lever you control. But targeting rarely fixes a metric problem, and worse, it resets Meta's learning phase and buys you a week of volatile data. Reading the chain tells you whether the leak is even in your reach at all. If CTR is healthy and conversion rate is the problem, no amount of audience tinkering will help, because the audience is fine and the page is broken. The map saves you from fixing the wrong thing fast.
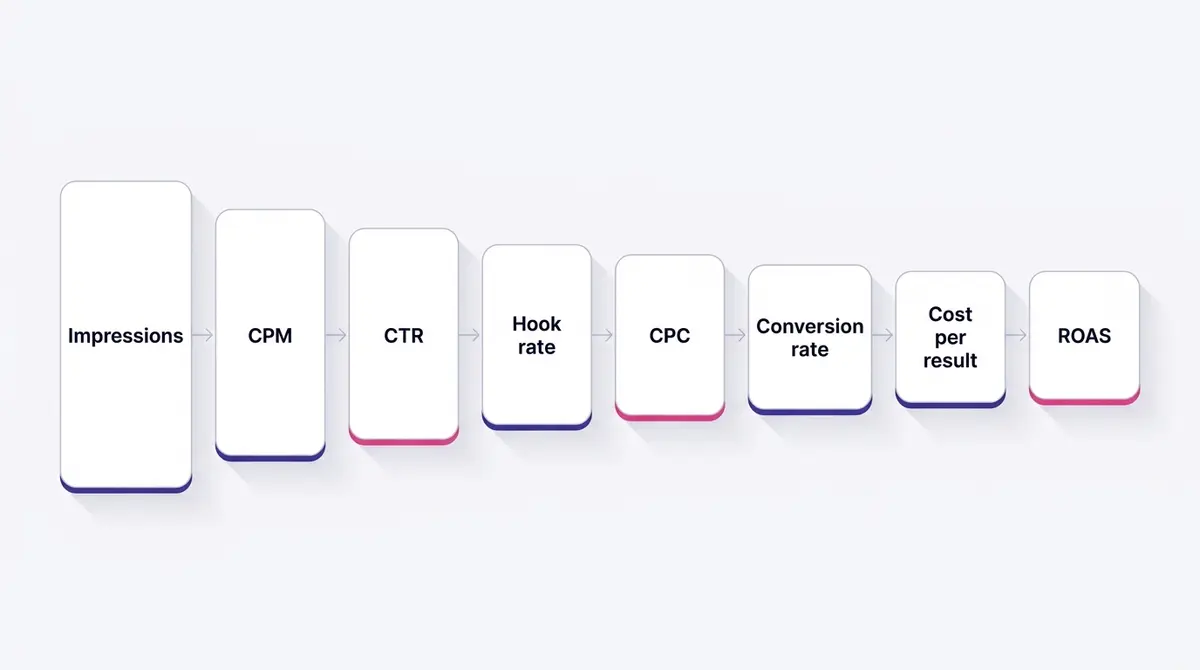
One caveat before the list. Every cost benchmark below drifts upward each year. Meta reported its average price per ad rose 9% year over year across full-year 2025, while impressions delivered grew 12%, per its own Q4 and full-year results (a vendor-own figure, so treat it as directional). That platform-wide inflation is why the smartest comparison is always your own same-month history, not last year's published average.
Which metrics lead for which objective
The chain is universal, but which link you watch first depends on what you asked the campaign to do. A metric that is the headline number for one objective is noise for another. An awareness campaign that frets over ROAS is reading the wrong column, and a sales campaign that celebrates cheap reach is fooling itself. Match the metric to the job before you judge the result.
| Objective | Lead metrics to watch | What is noise here |
|---|---|---|
| Awareness / reach | CPM, reach, frequency | ROAS, cost per result |
| Traffic | CTR, CPC, landing-page views | ROAS (no purchase yet) |
| Engagement | CTR, cost per engagement, hook rate | conversion rate, ROAS |
| Leads | Cost per result (cost per lead), conversion rate, CTR | bare reach |
| Sales / conversions | ROAS, cost per result (CPA), conversion rate | vanity reach |
Read that as a starting point, not a wall. Funnel stage matters as much as objective: a top-of-funnel prospecting ad is judged on CPM and hook rate, because its job is cheap, qualified attention, while a bottom-of-funnel retargeting ad lives or dies on ROAS and cost per result. The same CPM that is a triumph for an awareness ad is irrelevant to a retargeting ad that has to turn warm traffic into sales. Who you are talking to at each stage, and what to expect from them, is the framing in the funnel stages guide.
1. CPM: the price of being seen
CPM is cost per thousand impressions: spend divided by impressions, multiplied by 1,000. It is the entry price of the auction, set live every time someone opens a feed rather than from a rate card.
Across Facebook and Instagram, CPMs averaged $8.19 in 2025, per Gupta Media's analysis of tens of millions of impressions. Treat that as a midpoint, not a target. A retargeting campaign in a competitive niche can run several times higher with nothing wrong, because the auction is pricing a scarcer, higher-intent audience. CPM is mostly outside your control: industry, country, objective, and the calendar move it more than any setting you touch. The one lever you own is the creative, because ads people engage with win the same impression at a lower price. Meta's auction weighs three things, per its own documentation: your bid, the estimated chance the person takes your desired action, and the ad's quality. Two of those reward engaging creative, which is why a higher hook rate quietly lowers your CPM without you touching the bid. When CPM spikes for no seasonal reason, suspect fatigue first: the same audience seeing the same ad too often drives engagement down, and the auction repays that with a higher price. For the full breakdown of what feeds the auction, see the Facebook ad CPM guide.
2. CTR: did the creative earn the click
Click-through rate is clicks divided by impressions. It is the single fastest read on whether your creative is working, because it isolates the ad itself from everything that happens after the click.
WordStream's 2025 benchmarks put the all-industry average link CTR at 1.71% for traffic campaigns and 2.59% for leads campaigns. WordStream labels these as medians and does not always separate link clicks from all clicks, so treat both numbers as directional. The useful rule: anything above your own running average is a win, and anything below 1% usually means the creative is not stopping the scroll. CTR diagnoses the hook, the offer in the copy, and the thumbnail, in that order. When it sags, the fix is almost never targeting and almost always the first frame. Dig into healthy ranges by audience and placement in the good Facebook CTR guide.
3. CPC: what each click actually costs
Cost per click is spend divided by clicks, or equivalently CPM divided by CTR times a thousand. It is the metric that ties reach to traffic, and it moves the moment either CPM or CTR shifts.
Per WordStream's 2025 data, the average Facebook CPC was $0.70 for traffic campaigns and $1.92 for leads campaigns, again as directional medians. A rising CPC with a steady CPM is really a CTR problem wearing a disguise: the auction is charging you more per click because fewer people are clicking. That is why you read CPC and CTR together. A cheap CPC that never converts is not a bargain, so never optimise CPC in isolation from cost per result. The full benchmark spread by objective lives in the good Facebook CPC guide.
4. Cost per result: the metric you actually buy
Cost per result is what one of your chosen outcomes costs: a lead, a purchase, a landing-page view, whatever you set the campaign to optimise for. It is the only metric on this list that maps directly to money out the door, which is why it deserves the centre of your dashboard.
WordStream pegs the average Facebook cost per lead at $27.66 for the leads objective across all industries, a directional median drawn from 726 US leads campaigns running between April 2024 and June 2025. That all-industry figure hides a wide spread: in the same dataset, cost per lead ran from $3.16 in restaurants and food up to $76.71 for dentists, so the only benchmark worth comparing against is one from your own industry (the benchmarks by industry guide breaks the spread down). Cost per result is the product of everything upstream, so when it runs high you diagnose by walking the chain backward: normal CPM and fine CTR but expensive results points squarely at the landing page or the offer. A brand like UR Klinik measures a consultation-booking creative against that cost-per-lead benchmark and judges the whole ad on it, not on the click. The objective-by-objective view is in the Facebook cost per result guide.
5. ROAS: turning spend into profit
Return on ad spend is revenue divided by ad spend. A 4:1 ROAS means four dollars back for every dollar in. It is the metric that tells you whether the whole machine is profitable, and the one most often misjudged against a borrowed benchmark.
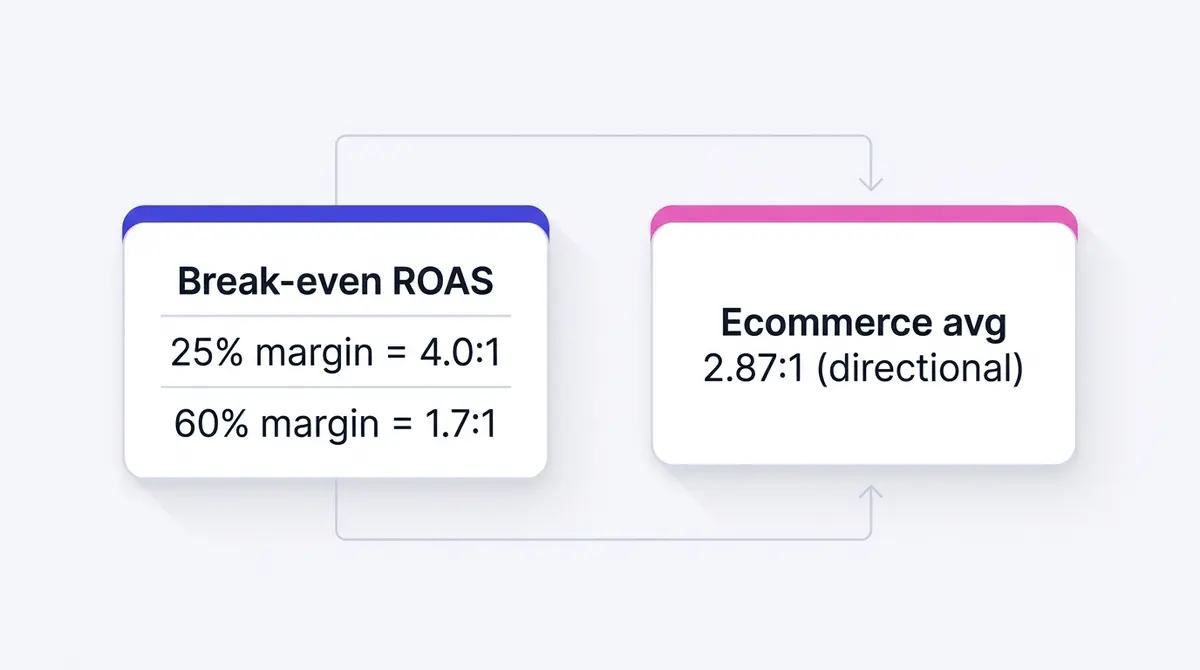
The honest target is not an industry average, it is your own break-even, which equals one divided by your gross margin. At a 25% margin you need roughly 4:1 just to cover costs; at a 60% margin you break even near 1.7:1. Published averages exist (one vendor cites 2.87:1 for ecommerce in 2025) but they carry no stated methodology, so use them as a directional sniff test and your margin math as the real line. A campaign beating a 3:1 published average can still be losing money on thin margins. Set the target from your unit economics, then read the deeper good ROAS guide.
| Gross margin | Break-even ROAS | What "profitable" looks like |
|---|---|---|
| 25% | 4.0:1 | Anything above 4:1 makes money |
| 40% | 2.5:1 | Above 2.5:1 makes money |
| 60% | 1.7:1 | Above 1.7:1 makes money |
| 80% | 1.25:1 | Above 1.25:1 makes money |
The table is arithmetic, not a benchmark: break-even ROAS is simply one divided by margin. It explains why a single "good ROAS" number is meaningless without your margin attached. It also explains why two brands can run the identical campaign and reach opposite conclusions: a 4:1 ROAS is a triumph at a 25% margin and a quiet loss once you factor in shipping, returns, and the cost of the goods at a thinner one. Always set the target from your unit economics before you read the dashboard, not after.
6. Frequency: how tired the audience is
Frequency is impressions divided by reach: the average number of times one person has seen your ad. It is the early-warning light on the dashboard, because it climbs before results fall.
Databox's median frequency sits near 2.43 for B2C and 2.51 for B2B advertisers, drawn from samples of several hundred companies each. That is an evergreen benchmark, periodically re-stamped rather than re-measured, so read it as a stable long-run median rather than a fresh 2026 reading. A practical working range is roughly 1.8 to 4 over a campaign window. The number itself is less important than its direction: frequency rising while CTR falls is the textbook creative-fatigue signal, and it pushes CPM up as the auction makes you pay more to keep reaching the same saturated pool. The fix is fresh creative, not more budget on the tired ad. The full treatment of when fatigue sets in and how to act on it is in the Facebook ad fatigue guide, and the healthy ranges by audience size sit in the good Facebook ad frequency guide.
7. Hook rate: the first three seconds
Hook rate, sometimes called the thumbstop ratio, is 3-second video plays divided by impressions, as a percentage. It measures one thing: how many scrollers your opening frames stopped. For video, it is the truest read on creative strength, because it isolates the hook from everything after it.
Meta defines 3-second video plays in its Business Help Centre, but there is no clean neutral benchmark for hook rate. Every percentage figure floating around traces back to ad-tool vendors, so present it by formula and judge it against your own account. The honest target is "higher than your best-performing ad's running average". A brand like Skinlycious leans on a face-to-camera testimonial open precisely because a human face earns those first three seconds before a cent of CPM is wasted on someone who was always going to scroll past. To engineer better openings, see the Facebook ad hooks guide.
8. Hold rate: did they stay for the message
Hold rate is ThruPlay divided by 3-second plays. ThruPlay counts a video watched to completion or for at least 15 seconds, per Meta's Business Help Centre. Where hook rate measures the stop, hold rate measures the stay: of everyone the opening caught, how many absorbed the actual pitch.
This is the metric that separates a clever hook from a complete ad. A high hook rate with a low hold rate means the opening over-promised and the body failed to deliver, so viewers bailed before the offer. The pattern is common with shock-open creative: the first frame stops everyone and the next five seconds disappoint everyone, so you pay for attention you cannot convert. The opposite pattern, a modest hook rate with a strong hold rate, often signals an ad worth scaling, because the people it does catch stay all the way through. As with hook rate, there is no neutral published benchmark, so measure each video against your own best. A brand like Beyond Collagen+ uses a founder explaining why she made the product, an open that pulls viewers past the three-second hook toward completion, which is exactly what hold rate rewards. The two video metrics together are the heart of the Facebook video ad guide.
9. Conversion rate: did the click close
Conversion rate is results divided by clicks (or landing-page views), as a percentage. It is the metric that lives almost entirely off Facebook, on your landing page, form, or checkout. It tells you whether the traffic you bought actually did anything.
WordStream's 2025 benchmarks put the average Facebook conversion rate at 7.72% for leads campaigns, a directional median and unusually high because the leads objective measured here uses Meta's native instant forms, where users never leave the app. Conversion rates on campaigns sending traffic to an external site run far lower, so compare like with like. When CTR is strong but cost per result is high, conversion rate is almost always the culprit: the ad did its job and the page did not. A brand like Shakura pairs a before-and-after reveal with a clear offer so the click converts rather than bouncing. To raise it, the levers are the offer, the page, and the match between ad and landing page, covered in the Facebook ad reporting guide.
10. Reach versus impressions: the saturation check
Reach is the count of unique people who saw your ad at least once. Impressions is the total number of times it was shown, repeats included. Frequency is the bridge between them. Keeping the distinction crisp prevents the most common dashboard mistake.
CTR and CPM are calculated on impressions, not reach, so an impression count climbing while reach stays flat means the same people are seeing the ad again and again. That is rising frequency by another name, and it precedes fatigue. Meta's Family Daily Active People reached 3.58 billion in December 2025 per its own results, so for most advertisers the audience is not the ceiling; saturation of a narrow targeting pool is. When reach plateaus, the answer is usually a broader audience or fresh creative, not a bigger bid into the same small pool. DataReportal's audience data is a useful neutral reference for sizing the addressable market.
The relevance diagnostics: why a high CPM has a reason
The ten metrics above tell you what is happening. Three more columns tell you why, and most dashboards leave them switched off. When a CPM comes back high or a CTR comes back weak, Meta will often explain itself if you add the ad relevance diagnostics to your report. There are three of them, and Meta scores each as above average, average, or below average against the other ads competing for the same audience, per its Business Help Centre. They replaced the older single relevance score, which handed you one grade with no breakdown.
Quality ranking compares the perceived quality of your ad, judged from signals like people hiding it and low-quality cues such as engagement bait or withheld information. A below-average quality ranking is the usual hidden tax behind a CPM that looks too high for your niche: the auction charges you more because the audience does not enjoy the ad. Engagement rate ranking compares how likely people are to click, react, comment, or share, which tracks closely with a CTR problem. Conversion rate ranking compares how likely people are to complete your optimisation event against ads chasing the same goal.
Read the three together, never one alone. A below-average quality ranking sitting next to healthy engagement points at creative that irritates more than it converts. A strong quality ranking next to a weak conversion ranking points past the ad, to the offer and the landing page. The diagnostics do not replace the chain, they tell you which link to trust your own eyes on first.
Reading clicks correctly: link clicks, clicks (all), and the landing-page leak
CTR and CPC both depend on which clicks you are counting, and Ads Manager counts clicks three different ways. Link clicks are clicks on the ad's link to its destination. Clicks (all) is everything: link clicks plus likes, comments, shares, profile taps, and clicks to expand the photo or video. Outbound clicks are the subset of link clicks that actually send someone off Facebook or Instagram to your site, per Meta's Business Help Centre. Because clicks (all) sweeps in engagement that never intended to visit your page, CTR (all) is structurally higher than link CTR, so a "2% CTR" means nothing until you know which one it is. Compare like with like, and when you read a published benchmark, assume it is link CTR unless it says otherwise.
Then watch the gap between link clicks and landing-page views. A landing-page view only counts when the page actually loads, so it sits one step past the click. When link clicks run well above landing-page views, people are tapping and then leaving before your page renders, which almost always means the page is slow or broken on mobile. That gap is a silent CPC killer: you pay for every link click, but only a loaded page can convert. If your conversion rate looks weak while CTR looks fine, check this ratio before you blame the offer. You may be losing buyers in the two seconds between the tap and the page.
Why your dashboard ROAS can still lose money
The ROAS in Ads Manager is not a neutral fact. It is a number Meta calculates about its own ads, inside an attribution window you are allowed to change. The default setting credits a conversion to your ad if someone clicked within seven days, or viewed within one day, before buying, per Meta's Business Help Centre. Widen or narrow that window and the same campaign reports a different ROAS without a single sale changing hands. View-through credit in particular flatters the dashboard, because Meta counts a sale from someone who merely saw the ad and bought a day later, even if they would have bought anyway.
This is why a 4:1 ROAS in Ads Manager can sit on top of a business that barely breaks even. The platform reports the revenue it can attribute to itself, and platforms tend to claim generously. The honest cross-check is blended ROAS, sometimes called MER (marketing efficiency ratio): total revenue across every channel divided by total ad spend, measured in your own analytics rather than Meta's. When the platform's reported ROAS runs well above your blended number, that gap is the over-claim. Read both: the in-platform ROAS to rank your ads against each other, the blended figure to judge whether the whole account is profitable. The mechanics of the calculation are in the how to calculate ROAS guide, the settings that move it in the attribution window guide, and the levers that lift it in the increase ROAS guide.
When a number is worth trusting
Before you act on any metric, ask whether it is signal or noise. Two things decide that: whether the ad set has finished learning, and whether enough data sits behind the number.
Every ad set starts in the learning phase, where Meta's delivery system is still working out who responds. It exits once it gathers roughly 50 optimisation events within the seven days after the last significant edit, per Meta's Business Help Centre. Below that threshold the ad set stays "learning limited" and its numbers swing day to day, so a CPA or ROAS read mid-learning is a guess, not a verdict. Worse, editing the audience, the budget, or the creative resets the phase and buys you another week of volatile data, which is why the discipline is to leave a new ad set alone until it stabilises. The full mechanics are in the learning phase guide.
Sample size is the other half. A 4% CTR on 200 impressions is eight clicks, which tells you almost nothing, and a cost per result built on two conversions can halve or double on the next sale. Marketers routinely kill a winning ad after one bad afternoon and scale a fluke after one lucky one. The fix is patience with a floor: wait for a few hundred link clicks before trusting a CTR, and for the ad set to clear the learning phase before trusting a cost per result. When in doubt, read a longer window against your own history rather than reacting to a single day.
Putting the map to work
These ten metrics are a diagnostic sequence, not a leaderboard. Read them top to bottom and each one hands the next a verdict: a healthy CTR clears the creative, so a high cost per result points downstream to the page; a climbing frequency explains a creeping CPM before you waste a day blaming the auction. The discipline is comparing each number to your own same-month history, because Meta's costs inflate yearly and last year's benchmark quietly lies to you.
The hardest part is acting fast on what the metrics reveal. Hook rate flags a weak open, so you need a new open shipped before the data goes stale; conversion rate flags a tired offer, so you need a fresh angle live this week (the creative refresh cadence guide covers how often to rotate before fatigue bites). Keeping research, generation, editing, and Meta launch in one place, as a platform like AdPlay.ai does, shortens the loop between reading a metric and shipping the fix it points to. For the workflow that turns these readings into a weekly routine, see the Facebook ad reporting guide, and to pressure-test new creative before it goes live, the creative testing guide.
Example ad angles
Representative hooks and formats from the category.
“Testimonial ad for hook rate: a face-to-camera open that earns the first three seconds”
“Before-and-after ad for cost per result: a pigmentation reveal that lifts the conversion rate”
“Founder-story ad for hold rate: a why-I-made-this open that keeps viewers to completion”
By the numbers
Frequently asked questions
What are the most important Facebook ad metrics to track?
Start with cost per result, because it ties spend to the outcome you actually want. Then read the chain that feeds it: CPM (auction price), CTR and hook rate (did the creative earn attention), CPC (cost of the click), conversion rate (did the landing page close), and ROAS if you sell directly. Frequency and reach versus impressions tell you whether the audience is getting tired or saturated. Ten metrics cover the whole funnel; you rarely need more.
What is a good CTR for Facebook ads in 2026?
WordStream's 2025 benchmarks put the all-industry average link CTR for traffic campaigns at 1.71% and for leads campaigns at 2.59%, though it labels these as directional medians. Treat anything above your own account's running average as healthy. A CTR well below 1% usually means the creative is not stopping the scroll, so look at the hook before you touch targeting.
What is the difference between reach and impressions?
Reach is the number of unique people who saw your ad at least once. Impressions is the total number of times it was shown, including repeat views. Frequency is simply impressions divided by reach. The distinction matters because CTR and CPM are calculated on impressions, not reach, so a high impression count with flat reach is a fatigue warning, not a growth signal.
How do I calculate hook rate and hold rate?
Hook rate is 3-second video plays divided by impressions, expressed as a percentage. It tells you how many scrollers your opening stopped. Hold rate is ThruPlay (a completion or 15-second view) divided by 3-second plays, which tells you how many of those who stopped stayed to the message. Meta defines both underlying metrics in its Business Help Centre. There is no clean neutral benchmark, so compare each against your own best-performing ad rather than a published number.
What is a good ROAS for Facebook ads?
ROAS is revenue divided by ad spend, so 4:1 means four dollars back for every dollar in. The honest benchmark is your own break-even, which equals one divided by your gross margin: a 25% margin needs roughly 4:1 just to break even, while a 60% margin breaks even near 1.7:1. Published averages exist (one vendor cites 2.87:1 for ecommerce in 2025) but they have no clear methodology, so use them as a sniff test and your margin math as the real target.
What frequency is too high on Facebook ads?
Databox's median frequency sits near 2.43 for B2C and 2.51 for B2B advertisers, an evergreen benchmark periodically re-stamped rather than re-measured, so treat it as a stable long-run median. A practical working range is roughly 1.8 to 4 over the campaign window. Past about 4, response usually falls and CPM creeps up as the same people see the ad repeatedly. Rising frequency with falling CTR is the textbook fatigue signal: refresh the creative rather than just raising budget.
Why is my cost per result higher than the benchmark?
Cost per result is the product of everything upstream: a high CPM, a weak CTR, or a poor conversion rate each inflate it. WordStream pegs the average Facebook cost per lead at $27.66 for the leads objective, but that is a directional median across all industries. Diagnose by walking the chain backward: if CPM is normal and CTR is fine, the leak is almost always the landing page or the offer.
Should I trust the ROAS and conversions Meta reports, or my own numbers?
Trust both, for different jobs. The ROAS in Ads Manager is calculated by Meta inside an attribution window (the default credits a sale to your ad if someone clicked within seven days or viewed within one day before buying), so it tends to claim generously and is best used to rank your ads against each other. To judge whether the whole account is profitable, read blended ROAS, also called MER: total revenue from every channel divided by total ad spend, measured in your own analytics. When Meta's reported ROAS runs well above your blended number, the gap is the over-claim.
Sources
- 1.WordStream, Facebook Ads Benchmarks 2025 (2025)
- 2.Gupta Media, Social Media Ads Cost (CPM Tracker) (2025)
- 3.Databox, Facebook Ads Frequency Guide (2026)
- 4.Meta, Fourth Quarter and Full Year 2025 Results (2026)
- 5.Meta Business Help Centre, 3-Second Video Plays (2026)
- 6.Meta Business Help Centre, About ThruPlay (2026)
- 7.Meta for Business, About Ad Auctions (2026)
- 8.DataReportal, Essential Facebook Statistics and Trends (2025)
- 9.Upcounting, Average eCommerce ROAS (2025)
- 10.Meta Business Help Centre, About Ad Relevance Diagnostics (2026)
- 11.Meta Business Help Centre, About Meta Metrics Being Removed (2026)
- 12.Meta Business Help Centre, About Facebook's Attribution System (2026)
- 13.Meta Business Help Centre, Link Clicks vs Outbound Clicks (2026)
- 14.Meta Business Help Centre, About the Learning Phase (2026)
Keep exploring
Turn ad research into winning ads
Research the ads that work, generate the creative on-brand, and launch to Meta, all in one tool.
7-day free trial · No credit card required