
Facebook Ad CPA Benchmarks by Industry 2026
What is a good cost per acquisition on Facebook ads? See 2026 CPA and cost-per-lead benchmarks by industry, plus the LTV guardrail that decides your real target.
Updated September 2026 · Likit Sae Lee, CTO

There is no single good CPA on Facebook ads: a good number is one that sits comfortably under your lifetime value, not under an industry average. Across all verticals the 2025 WordStream benchmark put the average Facebook lead cost at $27.66, up about 21 percent year over year, but it ranges from roughly $3 for restaurants to $77 for dental. Use the benchmark to sanity-check your vertical, then set your real ceiling so that customer value is at least three times acquisition cost, the threshold David Skok popularised for sustainable unit economics.
You launched a campaign, the dashboard shows a cost per acquisition, and now you are staring at it wondering whether it is good, bad, or quietly bankrupting you. The honest answer depends less on what other advertisers pay and more on what a customer is worth to you. This guide gives you real 2026 benchmarks by industry so you can place yourself on the map, then shows you how to convert that into a target your margins can actually carry.
What cost per acquisition means, and how to calculate it
Cost per acquisition is what you pay for one completed conversion: a purchase, a booked consultation, a submitted lead form, an app install, whatever you told Meta to count as a result. The formula is plain arithmetic. Divide the money a campaign spent by the number of results it produced.
CPA = total spend / number of results
Spend $2,000 and collect 80 leads and your CPA is $25. Spend the same $2,000 on a purchase objective and bank 40 sales, and your cost per purchase is $50. Ads Manager labels this column cost per result, and the result it counts is whichever optimisation event the ad set is chasing, which is why the same dollar figure means different things in two campaigns.
It helps to see what CPA is built from, because that is where you actually move it. A result costs you a click, plus the clicks you fail to convert. Put another way, cost per result is roughly your cost per click divided by your conversion rate. If clicks cost $1 and one in twenty converts (a 5 percent rate), each result costs about $20. Halve the conversion rate to 2.5 percent and the same clicks now cost $40 a result, with nothing else changed. Cost per click is itself downstream of CPM and click-through rate: a pricier thousand impressions or a weaker hook both raise what a click costs. So three dials sit under every CPA: how much reach costs (CPM), how many people click (CTR), and how many of those clickers convert. That is why the section below names creative the heaviest lever. A stronger creative lifts CTR and conversion rate at the same time, and since CPA is the product of both, the gains compound.
Why there is no universal good CPA
Ask ten advertisers what a good cost per acquisition looks like and you will get ten numbers, because they are all answering a different question. A restaurant filling tables and a dental clinic booking implant consultations both run Facebook ads, but a lead is worth a few dollars to one and several thousand to the other. So the first thing to accept is that CPA is meaningless in isolation. It only becomes useful when you anchor it to two things: what is typical in your vertical, and what a customer is actually worth to you.
The 2025 WordStream and LocaliQ benchmark, drawn from 726 US-based lead-generation campaigns measured between April 2024 and June 2025, put the cost per lead across all industries at $27.66. That dataset reports medians rather than means, so a handful of extreme accounts cannot drag the figure around. The number rose about 21 percent from the previous year's $22.87, while the median lead conversion rate slipped from 8.67 percent to 7.72 percent. Search Engine Land covered the same dataset under a headline noting Facebook costs jumped 21 percent but still undercut Google ($27.66 against Google's $70.11 cost per lead). Because that 21 percent was the all-industry average rather than one account's bad run, the upward pressure looks broad rather than a quirk of your account. In plain terms, leads got more expensive and slightly harder to convert in the same period. That macro pressure matters, because if your own CPA crept up over the last year, part of the story may simply be the auction getting more crowded rather than anything broken in your account.
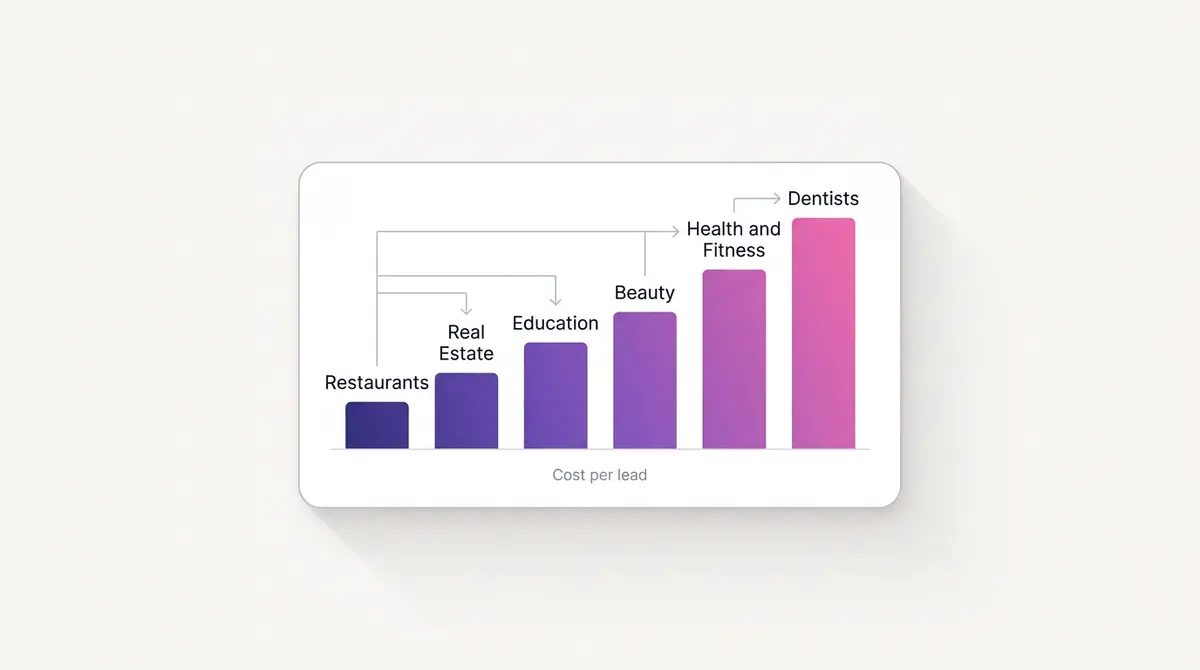
But the average hides enormous spread. The same dataset shows restaurants acquiring leads for $3.16 while dental services paid $76.71, a gap of more than twenty times. Neither number is good or bad on its own. The restaurant is selling a cheap, frequent purchase, so its acquisition cost has to be tiny. The dental clinic is selling a high-value treatment, so it can comfortably absorb a lead that costs the price of a nice dinner. Both can be running excellent campaigns. This is the core idea to hold onto: benchmarks tell you where you sit, your economics tell you where you should be.
2026 CPA and cost-per-lead benchmarks by industry
Here is the most useful slice of the 2025 lead-campaign data, the benchmark most advertisers carry into 2026 as a baseline. These are cost-per-lead figures, which are the cleanest public proxy for CPA on lead-generation objectives. Conversion rate is included because a low cost per lead with a weak conversion rate can still produce expensive customers. One caveat to read it with: these are median figures from 726 US-based lead campaigns measured between April 2024 and June 2025, published by a single provider (WordStream and LocaliQ share the dataset). It reflects one company's US sample rather than a worldwide census, so an account outside the US, or one running a very different offer, can sit well off these numbers for legitimate reasons. Useful as a compass, not as gospel.
| Industry | Avg cost per lead | Lead conversion rate |
|---|---|---|
| Restaurants and Food | $3.16 | 18.25% |
| Real Estate | $16.61 | 9.53% |
| Career and Employment | $17.64 | 5.77% |
| Arts and Entertainment | $18.17 | 9.34% |
| Attorneys and Legal Services | $18.17 | 10.53% |
| Sports and Recreation | $19.30 | 5.48% |
| Education and Instruction | $28.22 | 10.08% |
| Personal Services | $30.57 | 6.51% |
| Industrial and Commercial | $37.34 | 9.34% |
| Furniture | $40.04 | 3.77% |
| Home and Home Improvement | $41.26 | 5.22% |
| Physicians and Surgeons | $47.47 | 4.51% |
| Beauty and Personal Care | $51.42 | 5.29% |
| Health and Fitness | $52.98 | 5.63% |
| Dentists and Dental Services | $76.71 | 6.38% |
Read this top to bottom and a pattern appears. The cheapest leads belong to low-consideration, high-frequency categories where the buying decision is fast and the price is small. The most expensive leads belong to high-consideration services where one customer is worth a great deal and the auction is fiercely competitive. Beauty and Personal Care at $51.42 and Health and Fitness at $52.98 sit in the upper-middle band, which is worth noting if you sell skincare, supplements, or fitness, since those are crowded auctions where creative quality does a lot of the heavy lifting.
A word of caution on year-over-year swings. Some categories moved violently between 2024 and 2025: in the same dataset, arts and entertainment lead costs rose about 242 percent and dentists about 97 percent, while restaurants fell roughly 93 percent. Big swings in a single benchmark year usually reflect changes in the sample of advertisers measured, not a law of nature. Treat one year's number as a snapshot, and weight the multi-year direction more heavily than any single data point.
It is also worth separating the two campaign types that benchmark reports blend together. The figures above come from lead-generation campaigns, where the conversion is a form submission. Traffic campaigns, which optimise for clicks rather than a downstream event, behave very differently: the same 2025 dataset put the traffic cost per click at $0.70 against $1.92 for lead campaigns, with traffic ads clicking through at 1.71 percent (up from 1.57 percent) and lead ads at 2.59 percent (flat against 2.58 percent the year before). If you compare a traffic campaign's cheap clicks to a lead campaign's cost per lead and conclude one is winning, you have compared two unrelated objectives. Decide what acquisition means for your business first, then pull the benchmark that matches that exact objective, otherwise the comparison flatters or punishes you for no real reason.
The same trap hides inside conversion campaigns. Optimising for a deep event like a purchase costs far more per result than optimising for a shallow one like an add to cart, simply because fewer people complete it. A $4 cost per add to cart and a $45 cost per purchase can describe the very same funnel. So comparing your cost per add to cart against someone else's cost per purchase tells you nothing useful. Always check which event a benchmark counted before you set yourself against it.
One more nuance hides inside the conversion-rate column. Furniture sits at a respectable $40.04 cost per lead but converts at only 3.77 percent, which means a large share of those leads never become buyers. Restaurants convert at 18.25 percent, so almost one in five leads turns into something. A low cost per lead with a weak conversion rate can produce more expensive customers than a higher cost per lead that converts cleanly. This is exactly why the next section refuses to let cost per lead be the final word.
Cheap leads that never close
A low cost per lead can be the most expensive number on your dashboard. Meta's automated delivery is very good at finding people who will do the cheap thing you asked for, so a campaign optimised for raw lead volume will happily hand you a flood of $5 form fills from people who never intended to buy. The form was submitted, the result counted, the CPA looked great, and not one of them turned into a customer.
Run the arithmetic and the trap is plain. Say one source delivers leads at $8 and 4 percent of them become customers: you are paying $200 for every customer ($8 divided by 0.04). A second source delivers expensive $30 leads that close at 20 percent: that customer costs you $150 ($30 divided by 0.20). The dearer lead is the cheaper customer. A $5 lead that never buys is, in the end, more expensive than a $30 lead that does.
This is why cost per lead should never be judged alone. Track what happens after the form: the lead-to-sale rate, and ideally the revenue each source produces. If a cheaper source sends worse leads, its true cost per customer can dwarf a pricier source that brings people who actually buy. Optimising for a deeper event, feeding offline or CRM conversions back to Meta, and watching the conversion rate of each source rather than its lead cost alone all push delivery toward quality instead of volume.
The number that actually sets your target: lifetime value
Benchmarks place you on the map. Lifetime value tells you where you are allowed to go. The single most important reframe in this whole topic is that your CPA target should be derived from customer value, not copied from an industry average.
The widely cited rule, popularised by David Skok in his work on subscription economics, is that customer lifetime value should be at least three times the cost to acquire that customer. A ratio of 3 to 1 leaves enough margin to cover overhead, fund growth, and survive the inevitable errors in your own estimates. Drift well below it and the margin thins until you are at risk of buying revenue at a loss once real costs are counted; sit far above it and you may simply be underspending and leaving growth on the table. The same source pairs the ratio with a payback rule of thumb: aim to recover your acquisition cost in under twelve months, because a customer who takes two years to pay you back ties up cash you could be spending to grow. The rule was written for recurring-revenue businesses, but the logic travels well to any model where customers buy more than once.
Turn that into a working ceiling with one calculation. Estimate the gross profit a typical customer delivers over the period you are comfortable forecasting, divide by three, and that is roughly the most you should pay to acquire one. Here is how the same business can have very different verdicts on the same CPA depending on what a customer is worth.
| Customer lifetime value | Healthy max CPA at 3 to 1 | A $40 CPA verdict |
|---|---|---|
| $60 | $20 | Too expensive |
| $120 | $40 | At the edge |
| $300 | $100 | Comfortable |
| $600 | $200 | Excellent |
Notice that a $40 acquisition is a failure for the first business and a bargain for the last, with no change in the ad account at all. This is why two advertisers in the same vertical can look at the same CPA and reach opposite conclusions, and both be right. If you are still working out which conversions even count as an acquisition, it helps to first get clear on how Facebook reports each cost-per-result figure, because a mislabelled event quietly poisons every benchmark comparison you make afterwards.
Two refinements make this calculation sturdier. First, use gross profit, not revenue, as the basis for lifetime value. A customer who spends $300 but costs you $180 in product, shipping, and payment fees only contributes $120 of margin, and it is that $120, not the headline $300, that your acquisition cost has to fit inside. Advertisers who anchor to revenue routinely overpay and wonder why a campaign that looked profitable in Ads Manager loses money on the bank statement. Second, be deliberate about the time horizon. A 3 to 1 ratio measured over a customer's first ninety days will produce a far stricter ceiling than the same ratio measured over two years of repeat purchases. Pick a horizon you can defend with real repeat-purchase data, then hold every campaign to the ceiling it produces. The horizon you choose is a strategic decision, not a technicality: a brand confident in retention can afford a higher CPA today because it knows the customer keeps paying, while a brand with one-and-done purchases must win on the very first order or not at all.
CPA or ROAS: which should be your north star
CPA answers one question: what did a customer cost? Return on ad spend answers a different one: what did a dollar of spend bring back? Which you steer by depends on how much your order values vary.
For fixed-price lead generation, CPA is the cleaner target. Every consultation, demo, or sign-up is worth roughly the same, so a single cost ceiling captures the whole picture, and holding the line on CPA keeps you honest.
For ecommerce with a spread of order values, CPA alone misleads. Two customers can both cost $30 to acquire while one spends $40 and the other $400. A campaign that hits your CPA target can still lose money if it pulls in small baskets, and a campaign with a scary-looking CPA can be your best one if it attracts big spenders. That is exactly what return on ad spend is built to catch, because it weights every result by revenue instead of counting heads. Most ecommerce teams set a target ROAS as the primary guardrail and keep CPA as a secondary check on efficiency.
The two are not rivals. CPA tells you the cost of growth, ROAS tells you the quality of it. Lead-gen leans on the first, variable-value ecommerce leans on the second, and a healthy account usually watches both.
How to tell Meta your target CPA
Knowing your ceiling is half the job. The other half is deciding how hard to enforce it inside Ads Manager, where the bid strategy is the dial. Meta gives you three relevant choices, and each one trades cost control against delivery.
Highest volume, Meta's default, chases the most results your budget can buy and does not optimise for a cost target, so your CPA can swing while volume stays high. It is the right starting point when you are gathering data or you trust your economics to absorb some variance. Cost per result goal (the cost cap) lets you hand Meta an average cost to aim for: it bids dynamically to keep your cost around that figure over the campaign's life, which protects your CPA. The catch is delivery. Set the goal below what the auction will bear and Meta simply spends less, so a cap that is too tight can starve a campaign of volume. Bid cap is the strictest: a hard ceiling on every individual auction bid. Meta is clear that this caps the bid, not the cost you see in reporting, so it suits experienced advertisers who already know their auction.
A sensible path is to launch on highest volume to discover your true cost, then, once an ad set is stable and profitable, switch to a cost per result goal set near your real CPA to defend it as you scale. For the full decision, see the bid strategy guide.
Why your reported CPA might be lying to you
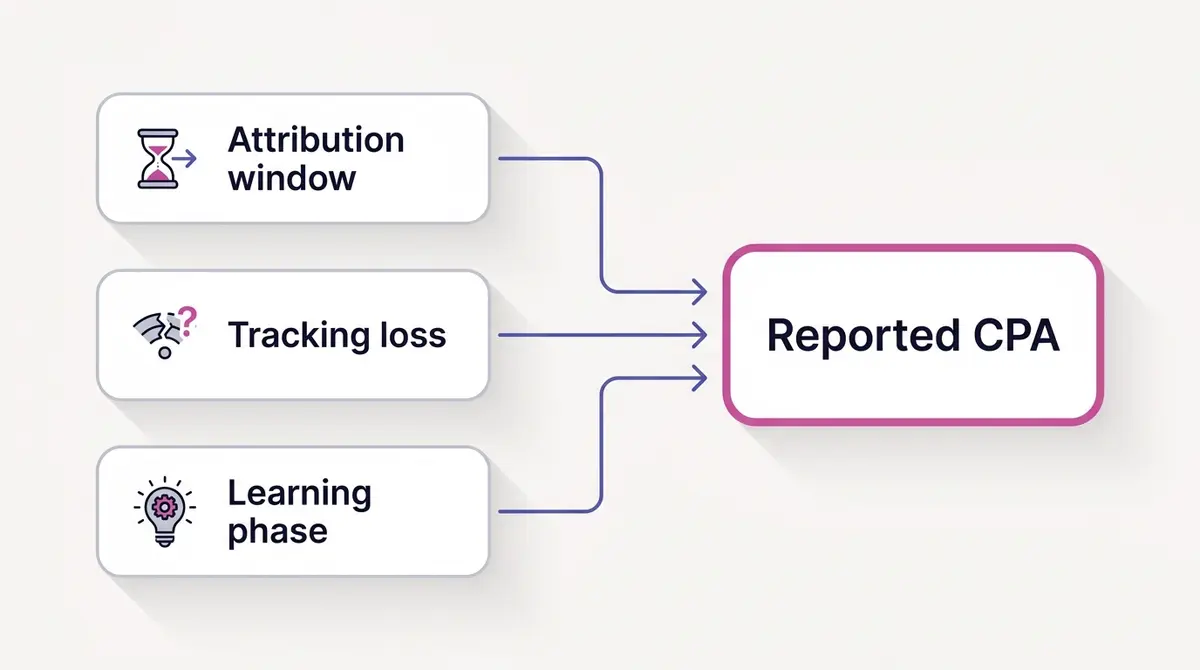
Before you act on a CPA, make sure the number is honest. Several common factors distort the figure in Ads Manager, sometimes flattering it and sometimes punishing it unfairly.
Attribution is the biggest culprit. The attribution window decides how far back in time Facebook looks to claim credit for a conversion. A wide window such as 7-day click pulls in more conversions and pushes your reported CPA down, while a 1-day click window counts fewer and pushes it up. Meta's defaults have shifted over the years, and the 2026 update reshaped the model again, with the standard setting moving toward 7-day click plus a new 1-day engage-through component plus 1-day view. The practical lesson is simple: a CPA is only comparable to a benchmark if both used the same attribution logic, and most public benchmarks do not tell you. When you compare your account to the table above, you are almost certainly comparing across different windows.
The second distortion is tracking loss. If your pixel or server-side events under-fire, real conversions go uncounted and your CPA looks worse than reality. Browser restrictions and consent changes have steadily eroded client-side tracking, which is why server-side measurement through the conversions API has become close to mandatory for accurate cost reporting. A solid conversions API setup often recovers conversions that the browser pixel alone misses, which can pull a seemingly bloated CPA back down to its true level without changing a single ad.
The third is the learning phase. Right after launch or a major edit, the algorithm has not yet found your cheapest converters, so early CPA runs high and unstable. Judging a campaign in its first few days, or restarting the clock with constant edits, traps you in a permanently expensive state. Give campaigns the conversions they need to exit the learning phase before you read the cost as gospel.
Why your CPA climbs in Q4 (and when not to panic)
Some CPA increases are not your fault at all. Facebook ads run on an auction, and the price of reach rises whenever more advertisers bid for the same finite inventory. The fourth quarter is the clearest case: Black Friday, Cyber Monday, and the holiday run pull every retailer into the auction at once, so CPM spikes and CPA rides up with it. Gupta Media's CPM tracker, which is directional rather than a Meta-published figure, clocked Meta's most expensive day of 2024 on Cyber Monday at $17.70 per thousand impressions, against a 2024 annualised average of about $7.43, roughly 138 percent higher on that single peak day.
If your CPA climbs every November and settles again in January, that is auction pressure, not a broken campaign, and a frantic rebuild usually makes it worse. Plan for it instead: budget more headroom into Q4, lock creative in early before review queues clog, and judge peak performance against last year's peak rather than against last month. A rise that tracks the calendar is the cost of playing in a crowded season, not a signal that the campaign stopped working.
How to drive CPA down once your benchmark is honest
Once you trust the number and you know your ceiling, the work becomes lowering cost without sacrificing volume. There is a wider menu of cost levers worth knowing, but for CPA specifically these three carry most of the weight, roughly in order of impact:
Creative is the heaviest lever, and it is not close. A stronger hook lifts click-through rate and conversion rate at the same time, and because CPA is downstream of both, improvements compound. This is why mature advertisers treat creative as their primary optimisation surface rather than bids or audiences. A disciplined creative testing system that ships several genuinely different angles each cycle finds winners faster than tweaking the same tired ad. The flip side is fatigue: even a winning ad decays as frequency climbs, so watching for creative fatigue and refreshing before performance craters protects CPA more reliably than any bid adjustment.
The offer itself is the second lever, and it is often underused. A clearer guarantee, a more relevant bundle, or a lower-friction first purchase can move conversion rate more than any targeting change. Real ad examples show this in practice. A clinic like UR Klinik tends to win lead-form conversions not by bidding harder but by making the first step feel low-commitment, a consultation rather than a sale. A supplement brand such as Beyond Collagen+ leans on stacked reviews and a subscription frame so that each acquired customer carries more lifetime value, which quietly raises the CPA the brand can afford. A fitness operator like Fitness Achievers often converts on a trial offer that lowers the perceived risk of the first booking. None of these are bidding tricks; they are conversion-rate moves that change the economics underneath the CPA.
Audience hygiene is the third lever. Excluding people who never convert, trimming overlap, and pointing spend at the audiences with real intent removes wasted impressions that inflate cost. The payoff is incremental rather than dramatic, but it is durable. Pair it with patience around the learning phase, because a campaign that keeps restarting never reaches the efficient state where CPA settles.
There is a measurement discipline underneath all of this. Driving CPA down is only real if you can see it move and feed that signal back into the next round of creative. Platforms that close the loop, generating new on-brand variations, launching them to Facebook and Instagram, then reading performance and fatigue to inform the next batch, make this cycle faster, and AdPlay.ai is built around exactly that loop. The point is not the tool, though. The point is that CPA improvement is a flywheel: measure honestly, change creative, measure again.
A practical checklist for setting and reading your CPA
Use this sequence the next time you are deciding whether a cost per acquisition is good.
First, calculate your ceiling before you look at any campaign. Estimate customer lifetime value, divide by three for a conservative starting ratio, and write that maximum CPA down. This single number does more work than any benchmark.
Second, place yourself on the industry map. Find your vertical in the table above and note whether you sit near, above, or below the typical cost. If you are paying double or triple the typical figure with no offsetting advantage in customer value, that is your signal to dig in.
Third, audit your measurement before you trust the gap. Confirm your attribution window matches what you think it is, check that your pixel and conversions API are firing, and exclude any campaign still inside the learning phase from your judgment. A CPA built on broken tracking will send you optimising the wrong thing.
Fourth, decide whether the problem is cost or value. If your CPA is genuinely too high relative to a healthy account, attack creative and offer first, because those move conversion rate and click-through together. If your CPA is acceptable but your margins still feel thin, the answer may be raising lifetime value through retention and repeat purchase rather than squeezing acquisition further.
Fifth, judge on a trend, not a day. CPA is noisy at small volumes, so read it over a rolling window of one to two weeks and watch the direction. A single expensive day inside a healthy trend is not a problem; a steady multi-week climb is. For a fuller picture of which numbers to watch alongside cost, the broader set of Facebook ad metrics shows how CPA sits inside the wider performance story rather than standing alone.
Do these five things and the question that opened this guide stops being mysterious. A good cost per acquisition is the one your customer value can carry, confirmed against your vertical, measured honestly, and trending in the right direction. The benchmark tells you where you are. Your economics tell you where to aim.
Example ad angles
Representative hooks and formats from the category.
“Testimonial ad for a patient describing a calmer skin result after a clinic consultation”
“Discount or Offer ad for a trial membership framed around a first session booking”
“Social Proof ad for repeat buyers stacking reviews behind a subscription offer”
“Showcase ad for a signature necklace styled as a gift-season hero piece”
By the numbers
Frequently asked questions
What is a good cost per acquisition on Facebook ads?
A good CPA is any number that leaves a healthy margin once you subtract it from a customer's lifetime value. As a rough sanity check, the 2025 cross-industry median cost per lead on Facebook was $27.66, so if your leads cost far more than that and your industry sits near the median, you have room to improve. But a $90 acquisition can be excellent for a high-ticket service and a $10 acquisition can be a disaster for a low-margin product. Always benchmark against your own economics first and the industry second.
How do I calculate cost per acquisition on Facebook ads?
Divide what a campaign spent by the number of results it produced: CPA equals total spend divided by conversions. Spend $2,000 and collect 80 leads and your CPA is $25; spend the same $2,000 for 40 purchases and your cost per purchase is $50. Ads Manager shows this in the cost per result column, where the result is whichever optimisation event the ad set is chasing. Because CPA is roughly cost per click divided by conversion rate, the fastest way to move it is usually a creative or offer that lifts both at once, not a bid change.
What is the difference between CPA, CPL, and CAC?
Cost per acquisition (CPA) is what you pay for one defined conversion event inside Ads Manager, such as a purchase or a completed lead form. Cost per lead (CPL) is a narrower version where the acquisition event is specifically a lead. Customer acquisition cost (CAC) is the broader business figure: total sales and marketing spend divided by new customers won, across all channels, not just Facebook. Your in-platform CPA is usually lower than your true CAC because it ignores team cost, tools, and the leads that never close.
Should I optimise for CPA or ROAS?
It depends on how much your order values vary. For fixed-price lead generation, where every result is worth about the same, CPA is the cleaner target and a single cost ceiling captures the picture. For ecommerce with a spread of basket sizes, CPA alone can mislead: two $30 customers are not equal if one spends $40 and the other $400. There, return on ad spend is the better north star because it weights by revenue, so most ecommerce teams treat ROAS as the primary guardrail and keep CPA as a secondary check. The two are complementary, not rivals.
Why did my Facebook CPA suddenly increase?
Sudden CPA spikes usually trace to one of four causes: creative fatigue as your audience sees the same ad too often, rising auction competition during peak seasons, a tracking break that under-reports conversions, or a campaign re-entering the learning phase after an edit. Check frequency first, then confirm your pixel and conversions are still firing. A jump that coincides with a holiday or sale period is often just temporary auction pressure rather than a broken campaign.
How does attribution affect my reported CPA?
Attribution decides which conversions Facebook claims credit for, which directly changes your reported CPA. A wider window such as 7-day click counts more conversions back to the ad, lowering CPA on paper, while a 1-day click window reports fewer and raises it. Meta's default has shifted over time and the 2026 update introduced a 1-day engage-through component alongside the familiar 7-day click and 1-day view. Always note which attribution setting a benchmark used before comparing it to your own numbers.
How do I lower my Facebook cost per acquisition?
The fastest lever is usually creative, because a stronger hook lifts click-through and conversion rate at the same time, which compounds into a lower CPA. Beyond creative, tighten your offer, fix tracking so conversions are not under-counted, exclude audiences that never convert, and give campaigns enough budget to exit the learning phase cleanly. Refreshing creative before fatigue sets in tends to protect CPA more reliably than constant bid tinkering.
What CPA should a new ecommerce store target?
Start from your margin, not from a benchmark. Work out the maximum you can pay to acquire a first purchase while staying profitable on a reasonable repeat-purchase horizon, then treat that as your ceiling. Many new stores aim for a value-to-acquisition ratio near 3 to 1 once repeat orders are counted. In the first weeks expect a higher CPA while the algorithm learns, and judge performance on a trend over several weeks rather than a single day.
Sources
- 1.WordStream / LocaliQ, 2025 Facebook Ads Benchmarks by Industry (2025)
- 2.LocaliQ, Facebook Advertising Benchmarks 2025 (2025)
- 3.Jared Sleeper (For Entrepreneurs / David Skok's blog), How to use LTV:CAC (2023)
- 4.Jon Loomer Digital, How Meta Ads Attribution Works in 2026 (2026)
- 5.Search Engine Land, Meta introduces click and engage-through attribution updates (2026)
- 6.David Skok, For Entrepreneurs, SaaS Metrics 2.0 Definitions (2023)
- 7.Search Engine Land, Facebook ad costs jump, beating Google's rise (2025)
- 8.Meta Business Help Center, About Meta Bid Strategies (2026)
- 9.Gupta Media, Social Media Ads Cost and CPM Tracker (2025)
Keep exploring
Turn ad research into winning ads
Research the ads that work, generate the creative on-brand, and launch to Meta, all in one tool.
7-day free trial · No credit card required