
Facebook Ad Conversion Rate Benchmarks 2026
What counts as a good Facebook ad conversion rate by industry in 2026, the neutral benchmark data behind it, and the levers that move your CVR.
Updated September 2026 · Likit Sae Lee, CTO

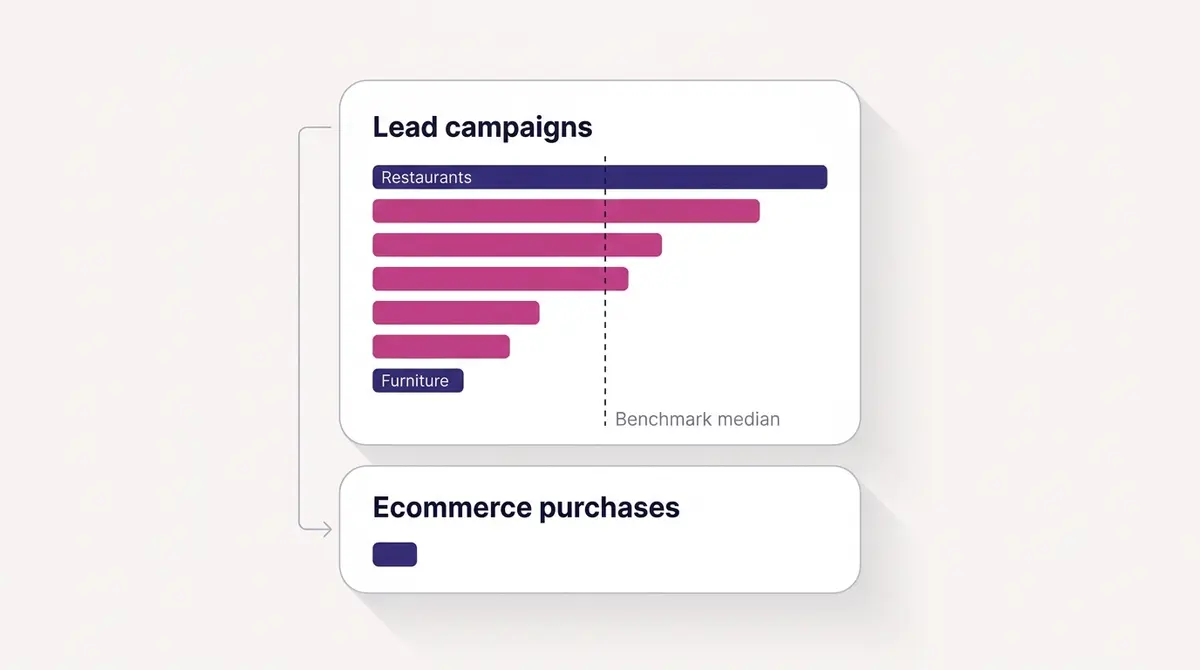
A good Facebook ad conversion rate sits near the industry median, which WordStream's 2025 benchmark study puts at 7.72% for lead campaigns, with figures ranging from 3.77% (furniture) to 18.25% (restaurants and food). For ecommerce purchases the bar is lower: Contentsquare's retail benchmark puts the online conversion rate near 2.0% on mobile and 3.7% on desktop. Compare against your own industry first, then move CVR with a sharper offer, a landing page that matches the ad, and stronger creative.
You launched the campaign, the clicks came in, and now you are staring at a conversion rate with no idea whether it is good or quietly bleeding budget. The honest answer is that there is no single number: a 4% rate can be excellent in one industry and poor in another. The way out is neutral benchmark data, a clear method for reading your own number against it, and the levers that actually close the gap.
What a "good" Facebook conversion rate actually means
The first thing to accept is that a conversion rate read in isolation tells you almost nothing. The number only becomes useful once you place it next to two things: your industry, and the action you are counting. A 5% rate is mediocre for a restaurant running lead forms and outstanding for a furniture brand selling high-ticket sofas.
WordStream's 2025 benchmark study, drawn from 726 US campaigns running between April 2024 and June 2025, puts the across-industry average for Facebook lead campaigns at 7.72%. That figure is a median, chosen deliberately so a handful of runaway campaigns do not drag the benchmark somewhere unrealistic. It is also down from 8.67% the year before, which matters: the bar is not static, and it has been drifting in the harder direction.
The spread underneath that average is enormous. Restaurants and food convert at 18.25%, because the "conversion" is often a low-commitment action like claiming an offer. Furniture sits at the bottom at 3.77%, because buying a sofa is a slow, considered purchase that rarely closes on the first click. If you benchmark a furniture brand against the 7.72% average, you will conclude you are failing when you are in fact performing normally. Find your row in the table, not the headline number.
There is a second, separate world: ecommerce purchases. Buying something with a credit card carries far more friction than submitting a lead form, so purchase conversion rates run much lower. Contentsquare's retail benchmark puts the online conversion rate near 2.0% on mobile and 3.7% on desktop, and because the bulk of Facebook and Instagram traffic is mobile, the 2% figure is the one that bites hardest. Most neutral sources cluster the ecommerce figure between 1.6% and 3.5% depending on how they count. So a 2.4% purchase rate that would look alarming next to a lead-gen benchmark is, for ecommerce, perfectly respectable.
The 2026 benchmark table by industry
Here is the neutral data, organised so you can locate yourself. These are all 15 lead-campaign industries from WordStream's 2025 Facebook study, with the conversion rate next to the cost per lead, because a rate read without its cost tells you only half the story. Treat this as the bar for lead-form and sign-up objectives.
| Industry | Conversion rate | Cost per lead | Source |
|---|---|---|---|
| All industries (average) | 7.72% | $27.66 | WordStream 2025 |
| Restaurants and food (highest CVR) | 18.25% | $3.16 | WordStream 2025 |
| Attorneys and legal services | 10.53% | $18.17 | WordStream 2025 |
| Education and instruction | 10.08% | $28.22 | WordStream 2025 |
| Real estate | 9.53% | $16.61 | WordStream 2025 |
| Arts and entertainment | 9.34% | $18.17 | WordStream 2025 |
| Industrial and commercial | 9.34% | $37.34 | WordStream 2025 |
| Personal services | 6.51% | $30.57 | WordStream 2025 |
| Dentists and dental services | 6.38% | $76.71 | WordStream 2025 |
| Career and employment | 5.77% | $17.64 | WordStream 2025 |
| Health and fitness | 5.63% | $52.98 | WordStream 2025 |
| Sports and recreation | 5.48% | $19.30 | WordStream 2025 |
| Beauty and personal care | 5.29% | $51.42 | WordStream 2025 |
| Home and home improvement | 5.22% | $41.26 | WordStream 2025 |
| Physicians and surgeons | 4.51% | $47.47 | WordStream 2025 |
| Furniture (lowest CVR) | 3.77% | $40.04 | WordStream 2025 |
A few things to read between the rows. The industries that convert highest are mostly the ones where the conversion is cheap and frictionless: claiming a meal offer, requesting class info, asking about a property. Where the action is heavier, the rate falls.
Now read the cost column alongside the rate, because it is the proof behind a point most benchmark posts skip: a high conversion rate is not automatically a good one. Restaurants and food convert at a remarkable 18.25%, and each of those leads costs about $3.16. Dentists convert at 6.38%, less than half the restaurant rate, yet each lead costs $76.71, roughly 24 times more. A dental practice converting at 6.38% is performing normally and profitably; a restaurant converting at 6.38% would be a disaster. The rate only means something next to what the result costs and what it is worth, which is why it pays to read it beside your cost per result and your cost per acquisition benchmark. For the full cross-channel picture by vertical, our Facebook ad benchmarks by industry guide sits alongside this one.
One more piece of context. WordStream found that 12 of 15 industries saw lead conversion rates decline year over year, while average cost per lead rose 20.94%, from $22.87 to $27.66. The implication is direct: you cannot lean on falling costs to bail out a mediocre funnel, because costs are climbing. Efficiency now has to come from the levers below.
It also helps to separate the two numbers people lump together. There is the rate at which clicks become conversions, which is what the benchmark tables above measure, and there is the rate at which the people who click are even the right people, which targeting and creative decide. A campaign can post a respectable conversion rate while quietly converting the wrong segment, and a campaign with brilliant targeting can post a poor rate because the landing page fumbles the handoff. When you read a benchmark, you are reading the second number, but the first one is what you actually control day to day.
Landing page conversion rate by industry
The Facebook table above measures the ad. The landing page is the second half of the conversion, and it has its own benchmark, also split by industry. Unbounce's Conversion Benchmark Report, built from 464 million visitors across 41,000 landing pages, puts the all-industry median at 6.6% but spreads widely underneath it.
| Landing page segment | Median conversion rate |
|---|---|
| All industries | 6.6% |
| Ecommerce, fashion and beauty (lowest subcategory) | 1.3% |
| Ecommerce, overall | 4.2% |
| Ecommerce, auto and industrial parts | 5.1% |
| Ecommerce, food and beverage (highest subcategory) | 7.1% |
Read this beside the Facebook lead numbers and a pattern repeats: the categories with a quick, low-stakes action convert several times higher than the ones asking for a considered, discretionary purchase. Within ecommerce, fashion and beauty sits near the bottom at 1.3%, because the buy is easy to put off, while the food and beverage subcategory climbs to 7.1% on the strength of low price points and repeat buying. Ecommerce overall lands at 4.2%, well under the 6.6% all-industry median, with auto and industrial parts in between at 5.1%.
On-site purchase conversion, the moment a card is actually charged, runs lower and varies just as much by category. One dated retail data set tracking ten sectors put the overall ecommerce conversion rate near 1.93%, ranging from roughly 5.01% for arts and crafts down to about 0.49% for baby and child products, with kitchen and home appliances near 3.00%. The takeaway is the same one the Facebook table teaches: there is no single "good" rate, only a good rate for your category and your conversion step. Benchmark a high-ticket store against a snack brand and you will misread a healthy number as a broken one.
How conversion compounds across the funnel
The headline conversion rate is not one number. It is several smaller rates multiplied together, and reading only the final figure hides where you are actually losing people. Decompose it and the leak becomes obvious.
Walk a round number through a typical ecommerce funnel. Say 1,000 people click the ad:
- 1,000 link clicks become 900 landing page views. Ten percent never arrive, lost to slow load, accidental taps, or an instant bounce. That is a 90% click-to-view rate.
- 900 landing page views become 225 add-to-carts, a 25% rate. Most visitors look and leave, which is normal even on a good page.
- 225 add-to-carts become 56 purchases, a checkout rate of about 25%. Roughly three of every four carts are abandoned, which tracks with the documented average: Baymard Institute's aggregate of 50 studies puts cart abandonment at 70.22%.
End to end, 56 purchases from 1,000 clicks is a 5.6% purchase conversion rate. But the headline 5.6% hides the truth that the two biggest leaks sit at the add-to-cart and checkout steps, where 75% of people drop each time. A 10-point improvement in the add-to-cart step (from 25% to 35%) would lift purchases from 56 to 78, a 39% gain, without touching the ad at all. That is why funnel thinking beats headline thinking: it tells you which step to fix first. Mapping those steps cleanly is the heart of building a Facebook ad funnel that respects each stage, and the individual rates each become a metric worth watching in their own right.
Lever one: the offer
The offer is the most underrated determinant of conversion rate, and the one marketers reach for last. People do not convert because your copy is clever; they convert because the trade feels worth it at that moment. A vague "learn more" converts a fraction of what a specific, time-bound, low-risk offer does.
Strengthening the offer can mean adding a reason to act now, reducing the perceived risk, or simply making the value concrete. A skincare brand running a representative before-and-after angle, the kind Skinlycious typically uses to show skin that cleared up over a few weeks, converts better when the page pairs that proof with a defined starter price than when it sends traffic to a generic catalogue. The creative earned the click; the offer closes it.
If your conversion rate is below your industry benchmark and your landing page is technically sound, look at the offer before anything else. Run two genuinely different offers against each other rather than two versions of the same one. The framework for structuring that kind of test cleanly is covered in our guide to running disciplined A/B tests on Facebook ads, and the psychology of why one incentive lands harder than another is unpacked in how ad buyers actually make decisions.
Lever two: message match on the landing page
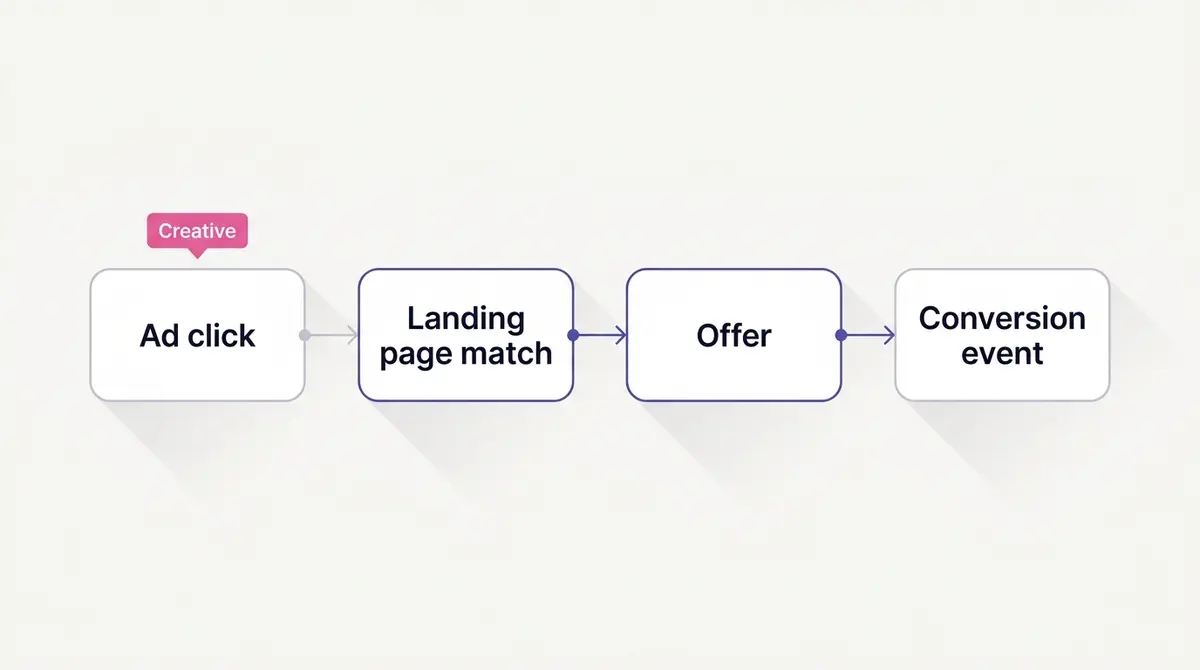
The single most common conversion killer is a broken promise between the ad and the page. Someone taps an ad about a specific product at a specific price, lands on a homepage that mentions neither, and leaves. The click cost you money; the mismatch wasted it.
Message match means the landing page repeats the ad's core promise in its first screen: same offer, same headline language, same hero visual where possible. Unbounce's data, with a 6.6% median across tens of thousands of pages, shows how much room most pages have to improve, and message match is the cheapest fix available because it requires no new traffic and no new creative, only alignment.
A useful discipline is to screenshot the ad and the top of the landing page side by side. If a stranger could not tell they belong together, you have found leaking budget. This is also where a lead campaign quietly outperforms a poorly matched purchase flow: the fewer steps and fields between click and conversion, the less room for the promise to break. Tightening that path is closely tied to the work in building a Facebook ad funnel that respects each stage.
Lever three: creative that pulls the right person
Creative does two jobs at once. It earns the click, and it pre-qualifies the person clicking. A loud, broad hook can lift click-through while tanking conversion rate, because it pulls in people who were never going to act. The goal is not the most clicks; it is the most clicks from people the offer fits.
This is why a testimonial or UGC angle often converts better than a polished brand film. When a real-feeling member of a gym describes sticking with a programme and seeing change, the way Fitness Achievers typically frames a member testimonial, the click that follows is warmer, because the person already pictured themselves in the result. Likewise a clinic running a representative limited-slot consultation offer, the kind of angle UR Klinik tends to use to drive lead-form sign-ups, converts because the creative and the action are tightly matched in intent.
The practical move is to keep a steady supply of fresh angles rather than one hero ad you ride until it fatigues. Conversion rate decays as the same audience sees the same creative repeatedly, which is the mechanism behind Facebook ad fatigue. Feeding new angles in before the old ones tire is what keeps the rate stable over a campaign's life, and it is far easier when you have studied which angles work in your category through structured competitor ad research.
Lever four: page speed and friction
This is the lever most marketers underweight, because it lives on the landing page rather than in Ads Manager, yet the evidence behind it is among the strongest in the field. Speed is not a nice-to-have. It is conversion volume you keep or lose before the visitor reads a word.
Portent's study of more than 100 million pageviews mapped the curve directly: as a page slows, the rate falls off a cliff, not a gentle slope.
| Page load time | Ecommerce conversion rate |
|---|---|
| 1 second | 3.05% |
| 2 seconds | 1.68% |
| 3 seconds | 1.12% |
| 4 seconds | 0.67% |
Roughly half the rate is gone by the third second. Lead-generation pages in the same study held up a little better but still bled, sliding from almost 40% at 1 second to about 34% at 2 seconds and 29% at 3 seconds. A separate study by Google and Deloitte, tracking 37 brands across more than 30 million sessions, found that a 0.1-second improvement in mobile site speed lifted retail conversions by 8.4% and average order value by 9.2%, with travel bookings up 10.1%. A tenth of a second, measured at scale, moved real revenue.
Friction is the wider category speed belongs to. Surprise shipping costs revealed at checkout, a forced account creation, too many form fields, and a checkout that demands pinch-zooming all leak conversions the same way a slow page does. The documented 70% average cart abandonment rate is largely a friction story. Strip a field, expose the total cost early, offer guest checkout, and compress the page weight, and you recover conversions you already paid to acquire. None of this needs a new ad.
Lever five: who you target, and how warm they are
A conversion rate is partly a property of the audience, not just the funnel. The same offer on the same page converts at very different rates depending on whether the person seeing the ad is meeting your brand for the first time or has visited your site three times this week.
Cold prospecting audiences, people who have never heard of you, convert lower almost by definition, because the ad has to build awareness and trust before it can ask for the sale. Warm retargeting audiences, built from website visitors, add-to-cart abandoners, or your customer list, convert far higher, because they arrive pre-qualified. This is why a campaign weighted toward retargeting will post a flattering headline conversion rate, and a pure cold-prospecting campaign will sit structurally below it. Neither number is wrong. They are measuring different jobs.
The practical consequence is a benchmarking trap. If you are running a cold-prospecting campaign to grow the top of the funnel and you judge it against a benchmark drawn mostly from mid-funnel retargeting, you will diagnose a failure that is really a structural difference in audience temperature. Read the rate against the job the campaign is doing. A prospecting ad set and a retargeting ad set should be held to different bars, and Meta's delivery leans hardest on conversion-optimised objectives when there is warm signal to work with. Segment your reporting by audience stage before you compare anything to an industry figure.
How to read your own number without fooling yourself
Before you celebrate or panic, sanity-check the measurement. Two campaigns can post wildly different conversion rates purely because of settings, not performance.
Confirm three things. First, the conversion event: are you counting purchases, leads, add-to-carts, or something softer? This is the micro versus macro distinction. A macro conversion is the action that makes money (a purchase or a qualified lead); a micro conversion is a smaller step toward it (an add-to-cart, a content view). Both show up in dashboards as "conversions", but a micro-conversion rate is not comparable to a macro one, and picking the softer event to make the number look healthier just trains delivery toward people who browse rather than buy. Optimise toward the macro event that maps to revenue and accept the lower, truer rate. Second, the attribution window: a 7-day-click window credits more conversions than a 1-day-click window, so a rate can rise without anything improving. Meta's own attribution settings documentation is the reference for what each window counts. Third, the denominator: rate over link clicks reads differently from rate over impressions. Lock these settings and keep them consistent, or your trend line lies to you.
Then account for signal loss, because a "low" rate is sometimes an undercount rather than a real problem. The browser pixel alone misses conversions blocked by ad blockers, cookie restrictions, and app-tracking limits, so sales happen that Meta never credits, and your reported rate reads lower than your real one. The fix is the server-side Conversions API, which sends the same events from your backend and, deduplicated against the pixel by a shared event ID, recovers many of the conversions the browser dropped. If your reported CVR sits oddly below your actual sales, check your tracking before you blame the funnel: our guides to setting up the Conversions API and deduplicating pixel and CAPI events walk the setup that closes that gap.
One more thing to hold in mind while you read the number: device skews it. Contentsquare's 2026 benchmark, drawn from 99 billion sessions across more than 6,000 sites, found desktop converting about 74% higher than mobile, while mobile accounts for nearly 70% of all traffic. Put those together and your headline conversion rate is effectively a mobile number, dragged down by the device most of your audience uses. Fewer form fields, faster load, and a checkout that does not demand pinch-zooming are not nice-to-haves; they are where most of your conversion volume is won or lost.
The truest baseline of all is not an industry table, it is your own past. Industry medians are directional; your own trend line, read in consistent monthly windows with the same conversion event and attribution settings, tells you whether you are actually getting better. Plot the rate month over month and annotate the changes: a new landing page in March, a creative refresh in April, a checkout fix in May. When the line moves, the annotation tells you why, and a half-point gain that compounds across a year of spend is worth more than matching a benchmark once. Use the industry figure to spot a gap, then race your own trend line to close it.
| Diagnostic | What a healthy reading looks like | What it suggests if off |
|---|---|---|
| CVR vs your industry benchmark | Near or above the WordStream row for your industry | Below: offer, page, or targeting problem |
| Cost per result trend | Flat or falling over weeks | Rising fast: fatigue or auction pressure |
| Landing page rate vs Unbounce 6.6% median | At or above 6.6% | Below: message match or page friction |
| Page load time | Under 2 seconds on mobile | Over 3 seconds: speed is bleeding conversions |
| Audience temperature | Benchmark matched to cold vs warm | Comparing a cold campaign to a retargeting benchmark |
| Conversion event quality | Counting the macro action that makes money | Micro events inflating a vanity rate |
Note that Meta-reported performance figures, like the claim that Advantage+ shopping campaigns deliver a roughly 5% lower cost per purchase than manual setups, are directional. They come from the platform that sells the placement, so treat them as a hypothesis to test on your own account rather than a guarantee. The neutral benchmarks above are the ones to anchor on.
A checklist for closing the gap
If your conversion rate is sitting below your industry benchmark, work this list in order. The sequence matters, because fixing the page before the offer, or the creative before the measurement, wastes effort on the wrong layer.
- Verify the measurement first. Confirm the conversion event, attribution window, and denominator, and check that the Conversions API is feeding clean events so signal loss is not deflating the number. Roughly a third of "low conversion rate" panics are measurement artefacts, not real problems.
- Find your true benchmark. Use the industry row, not the headline average, and match it to the audience stage: a cold-prospecting campaign should not be judged against a retargeting-skewed benchmark. A furniture brand at 4% is fine; a restaurant at 4% is broken.
- Check page speed and friction. Get the landing page under two seconds on mobile, expose costs early, and cut form fields. This is the cheapest, highest-evidence fix on the list.
- Audit message match. Put the ad and the landing page first screen side by side. If they do not obviously belong together, fix this before touching the offer or creative.
- Strengthen the offer. Make it specific, time-bound, and low-risk. Test two genuinely different offers, not two phrasings of one.
- Refresh the creative. Lead with proof, testimonial, or UGC angles that pre-qualify the clicker. Keep new angles queued before the current ones fatigue.
- Watch cost alongside rate. A higher conversion rate that costs more per result is not automatically a win. Read CVR next to cost per result and return on ad spend, the numbers that decide whether the campaign actually makes money.
- Relaunch and compare against your own baseline. Hold your attribution settings steady and race your own monthly trend line, not just the industry median.
The deeper point is that conversion rate is a downstream symptom of upstream choices: who you targeted, what you promised, and where you sent them. Benchmarks tell you whether there is a gap. The offer, the message match, and the creative are what close it. Tools like AdPlay.ai can shorten the loop from spotting the gap to shipping the fix, but the discipline above is what actually moves the number. Find your row in the table, fix the layer that is leaking, and judge the next campaign against the same honest baseline.
Example ad angles
Representative hooks and formats from the category.
“Before and After ad for skin that cleared up over a few weeks of use”
“Discount or Offer ad for a limited consultation slot that drives lead form sign-ups”
“Testimonial ad for a member who stuck with the programme and saw real change”
By the numbers
Frequently asked questions
What is a good conversion rate for Facebook ads?
There is no universal number, because it depends on your industry and what counts as a conversion. For lead campaigns, WordStream's 2025 study found an across-industry average of 7.72%, so landing near or above that is healthy. For ecommerce purchases the bar is much lower: Contentsquare's retail benchmark puts the online conversion rate near 2.0% on mobile and 3.7% on desktop. The right move is to find your specific industry benchmark and treat that as your baseline, then judge your own number against it rather than against a generic figure.
Why is my Facebook ad conversion rate so low?
Low CVR usually traces to a mismatch somewhere between the click and the action, not the ad alone. The three common culprits are a weak or unclear offer, a landing page that does not match the promise made in the ad, and creative that attracts the wrong people. Audit each in order. A 2% lead rate in an industry where the median is 8% signals a real problem; a 2% ecommerce purchase rate is roughly normal.
How is Facebook ad conversion rate calculated, including across a full funnel?
The headline rate is conversions divided by clicks (or sometimes impressions), shown as a percentage: if 1,000 people click and 50 buy, that is a 5% rate. Funnel conversion rate breaks that single number into the steps between, because the headline figure is the product of several smaller rates multiplied together. Picture 1,000 link clicks becoming 900 landing page views, then 225 add-to-carts, then 56 purchases: the view rate is 90%, the add-to-cart rate is 25%, the checkout rate is about 25%, and the end-to-end purchase rate is 5.6%. Decomposing it that way shows which step leaks the most, which a single headline rate hides. Always confirm which event and attribution window your report uses before comparing to a benchmark.
What conversion rate should ecommerce Facebook ads hit?
Ecommerce purchase conversion rates run far lower than lead-gen rates because buying involves money and more friction. Contentsquare's retail benchmark puts the online conversion rate near 2.0% on mobile and 3.7% on desktop, and most neutral sources cluster the figure between roughly 1.6% and 3.5% depending on methodology and sample. Food and beverage tends to convert highest due to low price points and repeat buying, while considered or luxury purchases convert lower. Judge an ecommerce campaign against the 2% to 3% band, not against lead-gen numbers.
Is a higher conversion rate always better?
Not on its own. A high conversion rate paired with a high cost per result or a low-value action may be worse than a lower rate that drives profitable sales. Conversion rate is one input; cost per result and return on ad spend tell you whether the campaign actually makes money. A lead form that converts at 15% but fills your pipeline with unqualified leads is a vanity win. Read CVR alongside cost and downstream value.
Did Facebook conversion rates drop in 2025?
For lead campaigns, yes. WordStream's 2025 study found that 12 of 15 industries saw conversion rates fall year over year, and the across-industry average slipped from 8.67% to 7.72%. Cost per result rose at the same time, up roughly 21% to about 27.66 US dollars. Rising costs and softening rates mean efficiency now comes from sharper creative and better landing pages rather than from cheap reach.
Does page load speed really affect conversion rate, and by how much?
Yes, and the effect is larger than most marketers expect. Portent's analysis of more than 100 million pageviews found ecommerce pages converting at 3.05% when they loaded in 1 second, 1.68% at 2 seconds, and 1.12% at 3 seconds, so roughly half the rate is gone by the third second. A separate Google and Deloitte study found that a 0.1-second mobile speed improvement lifted retail conversions by 8.4% and average order value by 9.2%. Because the bulk of Facebook and Instagram traffic is mobile, a slow page is one of the quietest conversion killers there is.
Why does my reported conversion rate look lower than my actual sales?
Two things commonly pull the reported number below reality. The first is signal loss: the browser pixel misses conversions blocked by ad blockers, cookie limits, and app-tracking restrictions, so a sale happens but never gets credited. A server-side Conversions API feed, deduplicated against the pixel, recovers many of those events and usually lifts the conversions Meta can attribute. The second is the attribution window: a 1-day-click setting credits fewer conversions than a 7-day-click one, so a rate can look low purely because of the window. Wire the Conversions API and lock your window before you conclude the campaign is underperforming.
Sources
- 1.WordStream (LocaliQ) Facebook Ads Benchmarks 2025 (2025)
- 2.Unbounce Average Conversion Rates for Landing Pages (2025)
- 3.Contentsquare Retail Digital Experience Benchmark: Conversions (mobile vs desktop) (2026)
- 4.Meta for Business, Advantage+ shopping campaigns (Meta-reported, directional) (2025)
- 5.Meta Business Help Center, About attribution settings (2025)
- 6.Portent, Site Speed Is (Still) Impacting Your Conversion Rate (2022)
- 7.web.dev (Google), Milliseconds Make Millions (Google and Deloitte study) (2020)
- 8.Contentsquare Digital Experience Benchmark, Conversions (desktop vs mobile) (2026)
- 9.Unbounce Conversion Benchmark Report, Ecommerce conversion rate (2024)
- 10.IRP Commerce, Ecommerce Market Data and Conversion Rates by Sector (2026)
- 11.Baymard Institute, Cart Abandonment Rate Statistics (2026)
Keep exploring
Turn ad research into winning ads
Research the ads that work, generate the creative on-brand, and launch to Meta, all in one tool.
7-day free trial · No credit card required