
The 7 Types of Facebook Ad Tools (2026)
Facebook ad tools fall into seven categories. What each one does well, where it stops, what running ads actually costs, and the five jobs a complete creative stack has to cover.
Updated August 2026 · Likit Sae Lee, CTO
Facebook ad tools fall into seven categories: ad spy and library tools, research and briefing tools, creative analytics platforms, AI ad generators, UGC and avatar video tools, enterprise creative automation, and creation or execution tools. Each one solves a single stage of the work, then hands you off to the next tool, which is why most teams end up running several at once. The 2026 martech landscape counted 15,505 tools, yet Gartner found marketers use only 33% of their stack's capability. Judge any tool by the job it does, the point where it stops, and what it costs to bridge that gap.
Somewhere between the tenth review tab and the third free trial, the question quietly changes from which Facebook ad tool is best to what any of them actually do. The honest answer is that the market sorts into seven categories, each built to own one stage of the work and each with a precise moment where it stops and hands the job back to you. Map the categories instead of the brand names and tool choice gets simple: you can see which stages your team has covered, which ones run on someone's spare time, and where the days between a good idea and a live ad are leaking.
Start with the job, not the tool name
Facebook ads reached 2.28 billion users in January 2025, by DataReportal's count, and a channel that size grows tools the way a reef grows coral. The 2026 marketing technology landscape catalogued 15,505 products, and even with net growth flat at under 1%, beneath that calm 1,488 new tools arrived and 1,367 were dropped in a single year. The names churn constantly; the categories underneath barely move, because they map to the stages of the work: find what is winning, decide what to make, make it, ship it, and learn from it.
So skip the roundups and ask three sharper questions of any product page: which stage of the work does this tool own, when does it hand the job back, and what does crossing that gap cost. Every tool stops somewhere, usually at an export button, and that stopping point, not the feature list, decides what it really costs you in time and in the next subscription you buy to bridge it.
What running the ads actually costs, and why it sets the tool budget
Tool spend is a second budget stacked on the media budget, so it only earns its place if it moves the first one. To judge that, you need the auction math in front of you. WordStream's 2025 Facebook Ads benchmarks, drawn from over a thousand campaigns across industries, put the average click on a traffic campaign at $0.70, down 6.67% year over year, against a 1.71% click-through rate. Lead campaigns run dearer: a click averages $1.92 and the average cost per lead reached $27.66, up roughly 21% in a single year. On the impression side, Gupta Media's CPM tracker put the average Meta cost per thousand impressions at about $8.19 across 2025, with sharp spikes into the teens around the Q4 retail peak.
Read those numbers together and the case for spending carefully writes itself. A lead that cost $22.87 last year now costs $27.66, so the same budget buys fewer, and the only lever that pushes the cost back down at scale is sharper creative. The same data shows where the platform earns its keep: Facebook's $27.66 cost per lead still undercuts Google's average of $70.11 for the same job, by WordStream's count, which is why the channel keeps growing despite rising prices. The point for a tool stack is blunt. Every seam in your workflow is a day, and every day is media you pay auction rates for while a stale ad keeps spending, so a tool that shaves three days off the path from insight to live test is not a convenience, it is cost recovery against those benchmarks. A tool that adds a step is the opposite.
The seven categories at a glance
Before the deep dives, here is the whole map in one view: what each category does, who it is built for, and the typical bottleneck that makes it worth buying. The prose below works through each row in turn, then the buying-guide sections turn the map into a purchase decision.
| Category | The job it owns | Built for | Worth buying when |
|---|---|---|---|
| Ad spy and library | Compress weeks of competitor scrolling into a searchable archive | Anyone deciding what angle to make next | You research the market often and the free library's lack of history slows you |
| Research and briefing | Turn references into hooks, scripts, storyboards, and briefs | Strategists handing work to a designer or editor | Briefing is the step that bottlenecks production |
| AI generation | Produce static, copy, and video drafts in minutes | Teams short on production hands | Making enough creative to test is the constraint |
| UGC and avatar video | Make one format well: scripted talking-head video | Teams with no creator on hand | Founder-to-camera video is your angle and you cannot shoot it |
| Creation and execution | Real editors plus publishing into the ad account | Operators who finish and ship in-house | Finishing and launching is where days leak |
| Creative analytics and reporting | Reorganize results around the creative, or package them for clients | Strategists, and agencies reporting to clients | You test enough to read patterns, or you owe someone dashboards |
| Enterprise automation | Spin out thousands of localized variants with approval rules | Catalog-scale advertisers | You have a real product feed and many markets, rarely a small team |
Research tools: spy libraries, briefs, and the Meta Ad Library
Ad spy and library tools archive other advertisers' ads so you can search them by keyword, format, or niche, and sort by how long an ad has run, a rough proxy for whether it works. The job they do well is compression: weeks of scrolling becomes an afternoon of pattern reading. Where they stop is the board: you leave with screenshots and a point of view, and none of the production work has started.
The free Meta Ad Library does the raw version of this job. It is Meta's own transparency database: search any advertiser or keyword and see every active ad, its creative, copy, start date, and the platforms it runs on, no account required. None of this is a grey area, since Meta built the library so anyone can inspect any advertiser's running ads; studying a competitor's creative is a sanctioned use of a public tool, not a privacy breach. Know its limits, though. For ordinary commercial ads it shows only what is running right now, so an ad disappears the day it stops, there is no performance data, and no way to save or organize what you find. Only ads about politics and social issues stay archived, for seven years, with spend and reach attached, and even then the spend appears as a wide bracket, never an exact number.
That last gap is why a swipe file matters: a saved collection of the ads that stopped you, captured before they pause and vanish, and tagged by competitor, format, and angle. Tag well and the patterns read themselves. Spend a week saving skincare ads, for instance, and the same playbook repeats: chains like Shakura run before-and-after angles (stubborn dark spots faded without laser, RM68 for two sessions) while aesthetic clinics like UR Klinik lead with doctor-operated trial offers from RM399. That shared move, a concrete price carrying the hook, only becomes visible because the captures were tagged. A board of 60 captures sorted by angle is a creative brief you can write from in an afternoon; a folder of unlabelled screenshots is not.
Research and briefing tools pick up where that saving ends, turning references into hook breakdowns, storyboards, scripts, and structured briefs a designer or editor can execute. They stop at the document: a brief is a plan for an ad, not an ad, and somebody still has to make the thing.
Creation tools: AI generators, UGC video, and editors
AI ad generators produce the raw material. Feed in a product image, a URL, or a prompt; get back static ads, copy variations, and increasingly video, with drafts that took a designer a day now taking minutes. Where they stop is context. A generator does not know which angle won in your account last quarter, what competitors saturated six months ago, or what your brand refuses to say. Output needs grounding before it ships and a destination after, because the files still have to be edited, finished, and launched elsewhere.
AI generation: the fastest-moving category, and what it does not do
This is the category readers ask about most, and the one changing fastest, so it earns a closer look. Adoption is no longer early. IAB's 2025 study with research partner Aymara, surveying 125 US advertising executives, found over half of marketers already use generative AI for creative content, and 58% plan to increase their AI for creative generation in the coming year. The direction is settled; the open question is what the tools are actually good for.
The honest framing is speed, not magic ROAS. A generator collapses the slowest part of production, the first draft, from a day to a few minutes, so a team can put five concepts in front of the auction in the time it used to take to finish one. That throughput is the prize, because more tests is the path to better results, not any single AI ad converting better than a human-made one. What the category cannot do is the judgement around the draft: it will not tell you which hook your competitors have already burned out, it does not hold your brand voice unless you feed it, and it will cheerfully produce twenty on-spec variations of a weak idea. So quality control stays with you. Used as a fast first draft inside a stack that researches before and finishes after, it is the highest-leverage tool on this list. Used as a vending machine for finished ads, it manufactures volume nobody should run, which is exactly how the "infinite AI ads" pitch keeps disappointing the teams that buy it.
UGC and avatar video tools make one thing well: scripted, talking-head video fronted by an AI presenter, for teams with no creator on hand. The style they imitate is real enough: hijab brand Mootiara, for one, fronts its own founder pitching a wrinkle-free instant hijab straight to camera, the exact founder-to-follower format these tools approximate with a synthetic presenter. But one format does not make a testing program, and the statics, carousels, and edits around it come from other tools.
Creation and execution tools sit at the opposite end: real editors (timeline video, layered graphics) plus publishing into the ad account. They do exactly what the research categories skip, the finishing and the shipping, but their blind spot mirrors it: arrive without research and you pick the angle on instinct, and once the ad is live the reporting is usually thin.
Testing and measurement: experiments, creative analytics, and reporting
Between launch and the final read sits a job many stacks skip: running the experiment cleanly. Ad-testing tools build structured comparisons (the simplest being a split test, where two creatives reach separate, non-overlapping audiences so neither steals the other's impressions) so the result is trustworthy. Eyeballing two ads in one ad set rarely settles anything: the algorithm starves the slower starter before it gets a fair chance, and you conclude from noise. Like the rest, these tools stop at a verdict; they tell you which variant won, not how to build the next contender.
Creative analytics platforms then connect to your ad account and reorganize performance around the creative instead of the campaign: which hooks earn the first three seconds, which formats convert, how fast each concept fatigues. The category matters more every year because, as Meta keeps absorbing the other levers, the creative is the variable you still control, and the data backing that claim sits in the cadence section below. But these platforms face backward: the chart proves hook A fatigued on Tuesday; the replacement ad does not make itself.
Reporting tools are the cousin teams confuse with analytics, and the distinction matters at purchase. Analytics is diagnostic and points inward, so a strategist can decide what to make next; reporting is presentational and points outward: scheduled exports, white-label dashboards, and tidy summaries built to send a client or a CMO on a cadence. An agency on ten accounts needs the second; a solo brand owner who reports to nobody can ignore it, and buying one to do the other's job is a common, expensive mismatch.
Enterprise creative automation is the last category here, and most small teams should know it mainly so they can skip it. Feeds, templates, and rules spin out thousands of localized variants with approval workflows: real work at catalog scale, but below it the pricing and configuration overhead buy nothing a lighter stack would not.
The tools you already have: Meta's native AI
Before you buy anything, account for what comes free inside the ad account, because Meta's own automation is now a category of its own and it changes which third-party tools you still need. Advantage+ hands budget, audience, and placement to the algorithm; Advantage+ Shopping pushes that further for ecommerce and, across a study of 15 A/B tests, drove a 12% lower cost per purchase than the advertisers' standard campaigns, by Meta's own 2022 measurement. What native AI handles is optimization and light creative; what it cannot do is the upstream thinking, naming the angle competitors saturated, grounding a concept in your brand voice, or building a finished video from a script. So lean on Meta's automation for targeting and delivery, and reserve third-party budget for research, original creative, and analytics deep enough to direct the next test.
How the categories map to the research, create, launch, measure loop
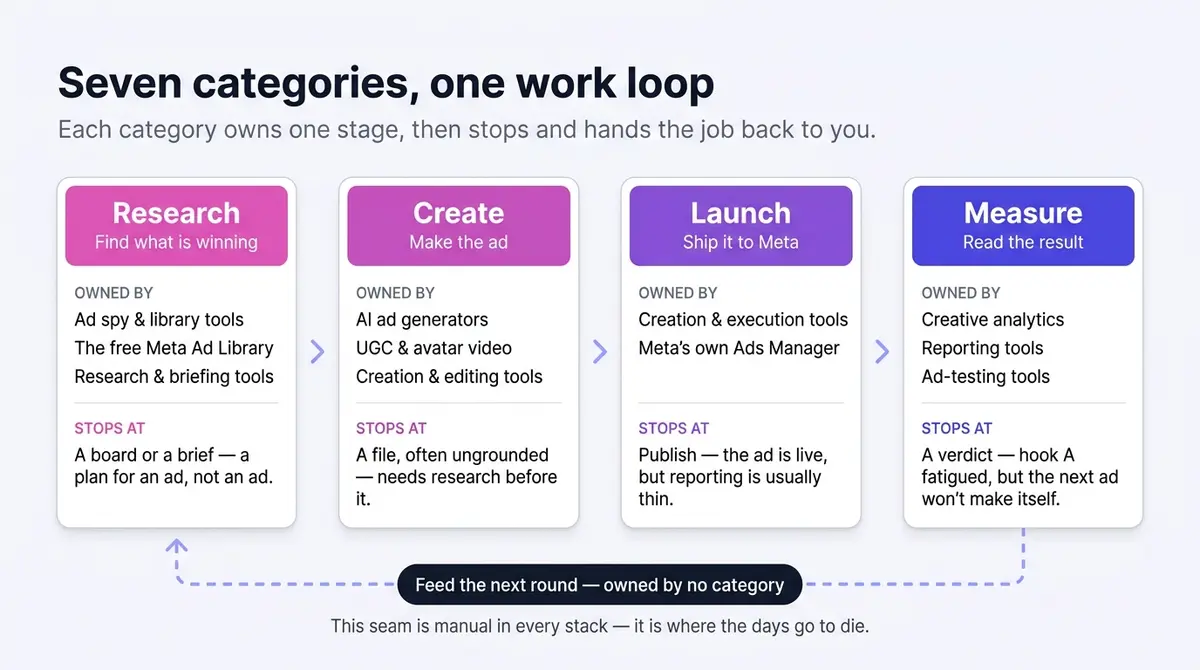
The seven categories look like a list until you lay them beside the loop the work actually runs on: research what is winning, create the ad, launch it, measure the result, and feed that read into the next round. Set against those stages, each category reveals exactly which one it owns and the precise handoff where it quits. That is the whole map, and it is what a roundup of brand names can never show you.
| Loop stage | Category that owns it | Where it stops, and what you do next |
|---|---|---|
| Research (find what is winning) | Ad spy and library tools, the free Meta Ad Library, research and briefing tools | Stops at a board or a brief: a plan for an ad, not an ad. You carry the references into production yourself. |
| Create (make the ad) | AI generators, UGC and avatar video, creation and editing tools | Stops at a file or an export, often ungrounded. The draft still needs a research input before and a launch after. |
| Launch (ship it to Meta) | Creation and execution tools, Meta's own Ads Manager | Stops at publish: the ad is live, but the loop is only half done and reporting is usually thin. |
| Measure (read the result) | Creative analytics, reporting tools, ad-testing tools | Stops at a verdict: the chart proves hook A fatigued, but the replacement ad does not make itself. The read has to travel back to research. |
| Feed the next round (close the loop) | No single category owns this seam | This is the gap every stack leaks in: the handoff back from measurement to the next test is manual, and it is where days go to die. |
Read the right-hand column top to bottom and the structural problem is obvious. Every category stops one step short of the next, so the loop only closes if a person carries the output across each gap by hand. The categories are real and each does its stage well; the cost is in the joins between them, which is the subject of the next section.
What a complete stack covers, end to end
The loop above describes one operator. Grow past a single person and a sixth job appears between editing and launching: review and approval, handled by creative-review and digital-asset-management tools that track which cut is final, who signed off, and where the master file lives. The seam is invisible at one person and painful at five: without it, "final_v3_REALLY_final" lives in someone's downloads, approvals scroll away in a comment thread, and assets get re-exported because nobody could find the first copy. A solo advertiser skips the category; a team or agency cannot.
The cost of the whole arrangement lives in the joins, not the tools. Export from the library, paste into the brief, generate, download, reformat for the editor, upload by hand, then wait for the report: each handoff adds a day or three, and the insight that looked sharp on Monday ships stale the following week. That is the number the buying-guide sections below are built to shrink.
Multi-platform tool or Facebook specialist: breadth versus depth
One axis cuts across every category above: channels. Run only Facebook and Instagram and the question never comes up. Run TikTok, Google, or YouTube as well and almost every category splits in two: a multi-platform version that pulls several networks into one dashboard, and a specialist that goes deep on a single network and leaves the rest to you. The trade is real and it is fixed: breadth buys you one login and one bill across channels, at the price of shallower features on any one of them; depth buys you the sharpest research filters, the most granular creative breakdowns, and the native quirks handled right, at the price of running a separate tool per network.
The decision is not about how many channels you run, it is about where your revenue sits. If most of your spend goes through Meta and the rest is a long tail, a shallow cross-channel dashboard optimizes the wrong slice while a Facebook specialist sharpens the part of the account that pays the bills, so depth wins. The breadth tool earns its keep only in the opposite case: spend split evenly across three or four networks on a small team, where the cost of juggling four specialist tools (four logins, four export formats, four mental models) outweighs the depth any one adds. A practical tell: if you can name the one network where a 10% creative improvement would move the most money, buy depth there first and add breadth only once that channel is handled. A tool bought for coverage you do not use is just the next section's overlap waste in advance.
The hidden bill: overlap and total cost of ownership
The sticker price is the smallest part of what a tool costs. Gartner's finding that marketers use only 33% of their martech stack's capability, down from 58% in 2020, is usually read as wasted features, but the sharper reading is wasted money: two-thirds of what you license sits idle, and a real slice of it duplicates a job another tool already does. Tool stacks accrete one free trial at a time, and nobody ever runs the audit that would catch the overlap, so the duplicate spend compounds quietly for years.
The duplication hides in three predictable places. The first is reporting: a creative analytics platform, a standalone reporting tool, and the native dashboards in your ad account often produce the same three charts, and you are paying for two of them out of habit. The second is research: a paid spy tool and the free Meta Ad Library cover the same active-ad lookup, and unless the paid tool is genuinely earning its keep on saved boards, alerts, and post-pause history, it is a line item doing free work. The third is generation: an all-in-one suite usually bundles a generator you forgot it had, sitting next to the standalone generator you actually open, so you license the same drafts twice.
Pricing models hide a second layer, and they rarely match how a stack grows. Per-seat pricing punishes the agency the moment a freelancer needs access for one project. Credit-based pricing on a generator looks cheap until a heavy testing week burns the month's allotment in three days and the overage rate kicks in. Flat pricing reads expensive on day one and turns into the cheapest option the instant your volume climbs. None of this shows on the comparison page; all of it shows on the invoice six months later. Then there is the cost with no line item at all, the bridging tax: every export-and-re-import between two tools is unpaid labour that scales with your testing volume, so the busier your team gets, the more those handoffs cost, exactly when you can least spare the hours. The honest total cost of a tool is its price, plus the seats and credits its model will force as you grow, plus the days its export button adds to every ad. Roundups quote the first number because they sell tools; they will not teach you to cut one, which is the most valuable move a stack owner makes.
Why creative cadence is the payoff for getting the stack right
Every argument above points at one outcome, so it is worth making explicit: the reason to fix the stack is to test more creative, faster, because creative is the lever that actually moves results. Nielsen attributes 56% of a campaign's sales ROI to the creative itself, and Google's analysis puts creative behind as much as 70% of campaign success, both figures Meta cites in its own creative guidance. As Meta keeps absorbing the other levers (Advantage+, its automated campaign machinery, passed a $20 billion annual run rate, up 70% year over year, by its early-2025 reporting), targeting and bidding are increasingly not yours to tune. The creative is what is left, and it is also the half with the most upside.
That is why cadence, not any single ad, is the number to watch. Fatigue forces it: as the same audience sees an ad again and again, frequency climbs, the response curve bends down, and a winner from three weeks ago quietly turns into a budget drain, the cost per result drifting up while nothing on the dashboard looks broken. The only durable answer is a steady supply of genuinely new concepts, not headline tweaks, entering the auction before the current ones tire. A stack that ships one fresh concept a month cannot outrun fatigue; one that ships several a week stays ahead of it. So velocity is what to optimize, because results compound through testing cadence, the read-then-ship loop in how to run a Facebook ad, and the time from insight to live test is the direct path to the ROAS those cost benchmarks demand. A platform like AdPlay.ai keeps the five jobs in one place, research through Meta launch and the reporting after, but the principle holds for any stack: every seam you remove converts directly into tests you ship.
How to judge any tool, and where to start
The category tells you what a tool is for. These dimensions tell you whether a specific one is worth it.
| What to check | The question it answers |
|---|---|
| Stopping point | Where does it hand the job back: a board, a brief, a file, or a live ad? The further it carries the work, the fewer tools you bolt on after. |
| Depth in its job | How big and current is the research coverage, or how granular the creative breakdown? A shallow tool is a second subscription waiting to happen. |
| Filtering and search | Can you cut to the exact format, niche, or metric, or do you scroll? The value of research and analytics is finding signal fast. |
| Performance context | Does it show how creative performed, or only that it exists? An ad you cannot rank by results is inspiration, not evidence. |
| Integrations | Does it connect to your ad account and the next tool, or export to a folder? Every missing link is a copy-paste you pay for in time. |
| Pricing model and seats | Per seat, account, credit, or flat? The sticker price rarely matches the real cost once your team and volume grow. |
| Free tier or trial | Can you validate it on your own data first? A tool that will not let you test it on your work is asking for blind trust. |
Those checks rank a tool inside its category. The harder question is which category to buy first, and there is no universal answer: it depends on what is slowing you down, which scales with budget and headcount. Find your row below, fix that bottleneck, and ignore categories built for a stage you have not reached.
| You are here | Real bottleneck | Start with | Skip for now |
|---|---|---|---|
| Solo, under a few thousand USD a month in spend | Making enough creative to test at all | The free Ad Library, plus one generation or editing tool | Reporting, asset management, enterprise automation |
| Small team, low five figures USD a month | Research and production both run on spare time | A research archive plus a creation tool that reaches launch | Enterprise automation, heavy cross-channel suites |
| Scaling brand, past mid five figures USD a month | Reading your own creative data, keeping cadence | Add creative analytics on top of research and production | Enterprise automation unless you have a real catalog |
| Agency or multi-account | Client reporting and approvals, not just making ads | Add reporting plus a review or asset-management layer | Single-account tools that will not scale to many clients |
The pattern is simple: spend on the stage that is leaking days, not the most impressive category. A brand that cannot produce enough creative needs a faster path from idea to ad, not a deeper analytics tool.
Audit your stack in an afternoon
Turn this map into a decision. Write down the five jobs and list every tool and spreadsheet you pay for against them; two patterns jump out, jobs covered twice and jobs covered by nothing but someone's spare time. Then trace your most recent ad from first reference to live, counting the handoffs and the days each one added. That number is your real creative velocity, the one benchmark you can act on this week. Fix the costliest seam first, then re-run the audit quarterly: the tool landscape keeps growing, and your stack should not.
By the numbers
Frequently asked questions
What is the Meta Ad Library and is it free?
The Meta Ad Library is Meta's own transparency tool: a searchable database of every ad currently running across Facebook, Instagram, and Meta's other surfaces. It is completely free and requires no account. You can search by advertiser name or keyword and see the creative, the copy, the start date, and the platforms each ad runs on. For ordinary commercial ads it shows active ads only, so an ad disappears once it stops running. Ads about politics or social issues are the exception: those stay archived for seven years, with spend and reach data attached.
Do I need an ad spy tool to run Facebook ads?
No. The Meta Ad Library already shows every active ad from any advertiser for free, and that covers basic competitor checks. Paid spy and library tools add conveniences on top: filters by format or niche, saved boards, alerts when a competitor launches something new, and a record of ads after they stop running. Whether that is worth paying for depends on how often you research. A team reading the market weekly will feel the difference; an occasional looker will not.
What is creative fatigue, and which type of tool helps me catch it?
Creative fatigue is what happens when the same audience sees an ad too many times: frequency climbs, response falls, and the cost per result drifts up while nothing on the dashboard looks obviously broken. The tool that catches it is creative analytics, which reorganizes your account's results around the creative instead of the campaign and flags how fast each concept is tiring. Do not confuse it with a reporting tool, which is its near-twin: same dashboards at a glance, opposite readers. Creative analytics is built for the person deciding what to make next, so it digs into which hooks and formats drive results and how quickly each one fatigues. A reporting tool is built for the person you answer to, packaging those numbers clean enough to hand a client or a boss on a schedule. The solo owner who reports to nobody wants the analytics and can skip reporting; the agency juggling many accounts often needs both. Buy one expecting it to do the other's job and you have bought the wrong half.
Can AI Facebook ad tools actually improve ROAS, or just speed up production?
Mostly the second, which then enables the first. AI generators make drafts in minutes instead of a day, so the direct win is volume and speed, not a magic lift in return. ROAS improves indirectly: faster production means more tests, and creative is the biggest lever on results, with Nielsen attributing 56% of a campaign's sales ROI to the creative itself. So AI tools raise returns by helping you test more good creative, not by making any single ad convert better on its own. Quality control still falls to you, which is also the answer to whether a generator is worth it when you already have a designer: it is, because it changes their job rather than replacing it. The designer stops building every first draft from scratch and starts directing and finishing a batch the AI roughed out, so the team ships more concepts a week without dropping the taste and brand judgement the AI does not have. Adoption already reflects this: IAB's 2025 study found over half of marketers use generative AI for creative and 58% plan to increase it.
Are free Facebook ad tools enough, or do I eventually have to pay?
Free is genuinely enough to start, and longer than most roundups admit. Ads Manager builds and launches campaigns, the free Meta Ad Library covers basic competitor research, and native reporting reads the results, which is a complete loop for a solo advertiser. Paid tools earn their place only as volume grows: once a team is testing several creatives a week, manual research, production, and reporting become the bottleneck, and a research archive, a generation tool, or an analytics layer starts paying for itself. The trigger is a measurable slowdown at a specific step, not a roundup's ranking. And the cost benchmarks decide whether the math works at all: with WordStream putting the 2025 average cost per lead at $27.66, up about 21% year over year, a paid tool only justifies its fee if it sharpens creative enough to push that number back down. If it does not touch your cost per result, it is overhead.
Is it legal to spy on or analyze competitors' Facebook ads?
Yes. Studying the ads a competitor is actively running is a sanctioned use of public information, not a privacy breach. Meta built the Ad Library specifically so anyone can search any advertiser and see their live creative, copy, and run dates without an account. You are reading the same ads the platform shows the public, not accessing private account data, budgets, or audiences. What you cannot see is a competitor's exact spend or results: for ordinary commercial ads none of that is published, and even for political ads the spend appears only as a wide range.
What should I check before paying for a Facebook ad tool, and how do I spot overlap?
Three things. First, the exact point where the tool stops: does it end at a saved board, a brief, a folder of exports, or a live ad, and what happens after that point. Second, overlap: many tools quietly duplicate something you already pay for, and Gartner found marketers use only about a third of their stack's capability. To spot it, list the five jobs (research, generate, edit, launch, measure) and write every tool you pay for against the job it does, then look for any job with two tools on it, the most common duplicates being two reporting layers, a paid spy tool sitting on top of the free Ad Library, and an all-in-one suite's forgotten generator next to your standalone one. Third, fit with your volume and pricing model: enterprise automation assumes catalog scale most small teams never reach, and a per-seat or credit plan that looks cheap today can outrun a flat plan as your team and testing volume grow. A free trial spent moving one real ad through the tool answers all three.
Should I pick tools per channel or one multi-platform tool, and does the answer differ for a small business versus an agency?
Decide breadth versus depth on where your revenue sits, not how many channels you run. If most of your spend goes through Meta, a Facebook specialist gives you the sharpest research filters and creative breakdowns where the money is, and a shallow cross-channel dashboard would optimize the wrong slice. Only when spend is genuinely split across three or four networks does one multi-platform dashboard beat juggling four specialist tools. Team size then layers on top, because a small business and an agency have opposite bottlenecks. A solo advertiser struggles to produce enough creative to test, so its money goes to research (the free Ad Library works) and one tool that gets an ad to launch-ready, skipping reporting, asset management, and enterprise automation. An agency's bottleneck is managing many accounts, so it adds reporting tools for client-ready dashboards and a review or asset-management layer for approvals. The rule holds either way: let your real bottleneck and your main revenue channel pick the tool, and ignore whichever category is getting the loudest reviews.
Sources
- 1.ChiefMartec, 2026 Marketing Technology Landscape Supergraphic (2026)
- 2.MarTech, Marketers are only using one third of their stack's capability (Gartner survey) (2023)
- 3.DataReportal, Essential Facebook Statistics and Trends (2025)
- 4.Meta for Business, High-quality creative increases ad ROI (citing Nielsen and Google) (2022)
- 5.Meta, Introducing new automation tools to increase sales (Advantage+ Shopping A/B tests) (2022)
- 6.AdExchanger, Meta Q4 Earnings and Advantage+ Growth (2025)
- 7.Meta Transparency Center, Ad Library tools (2026)
- 8.WordStream, Facebook Ads Benchmarks 2025 (2025)
- 9.IAB / Aymara, AI Adoption in Advertising (2025)
- 10.Gupta Media, Social Media Ads Cost and CPM Tracker (2025)
Keep exploring
Turn ad research into winning ads
Research the ads that work, generate the creative on-brand, and launch to Meta, all in one tool.
7-day free trial · No credit card required